Set up Alerts using Website Rules
To set up alerts for your monitors, you need to configure website rules; this enables you to set criteria for when and how your monitors will trigger alerts and which delivery groups will receive the alert.
There are two main ways to add a new website rule:
- Go to the settings for the monitor you want to set up an alert for.
- Configure in your account settings.
Set up Website Rules in monitor settings
Go to your monitor settings and navigate to the Alerts tab.
- Learn more about editing your monitor:
- Edit an Uptime Monitor
- Edit a Page Load Monitor
- Edit a Core Web Vitals Monitor
- Edit a Google Lighthouse Monitor
- Edit User Journey Settings
Set up Website Rules in account settings
Go to Settings > Website Rules to find a list of all website rules on your account. Click View to see more details on the monitor. This is divided into different tabs for each monitor type.
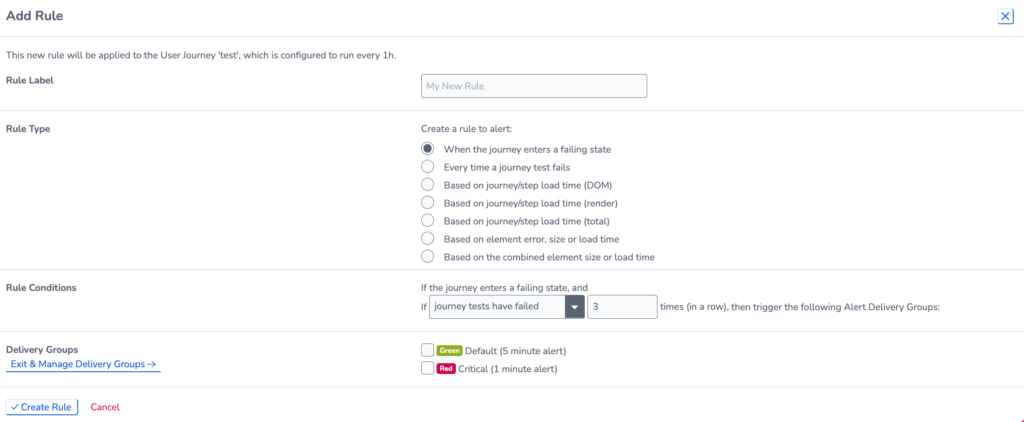
To set a website rule you must:
- Create a Rule Label to describe the alert
- Select a Rule Type to specify what type of event you want to alert for. You may also need to select which regions to use data from.
- Set Rule Conditions for when an event triggers an alert. You can set how many times the monitor should fail before you receive an alert.
- Pick the Delivery Groups you want to be alerted if the conditions are met.