Set up a Page Load Monitor
Table of Contents
Introduction
RapidSpike’s Page Load Monitor keeps track of your page load performance. You can monitor whether or not a page loaded properly, if anything was missing, or if any files were too big.
Add a Page Load monitor to a new page
By default, RapidSpike creates a new Page Load monitor automatically when you add a new page in Rapidspike.
Add a Page Load monitor to an existing page
You may also want to add a Page Load monitor to an existing page. There are two ways to do this:
- If the page does not yet have a Page Load monitor configured, navigate to Settings > Websites, Pages, User Journeys & Sitemaps and find the page where you want to add the new monitor. Click Create.
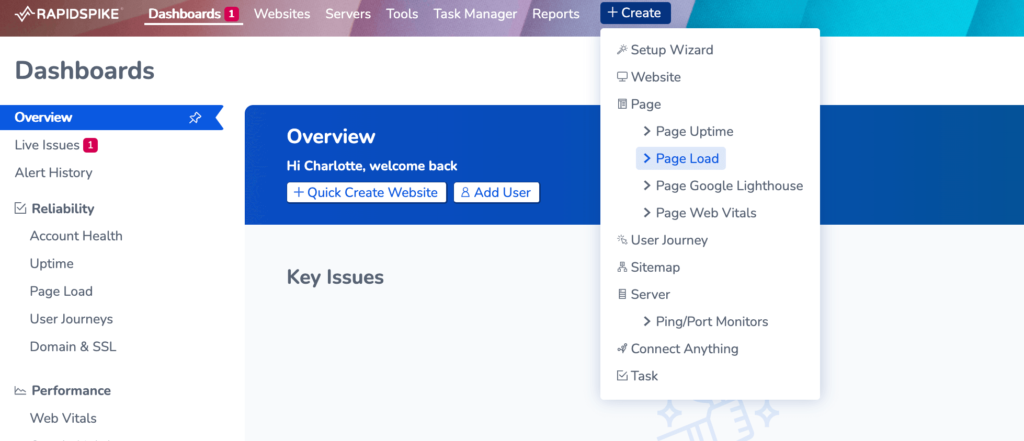
- Click the Create button at the top of the page and select Page Load.
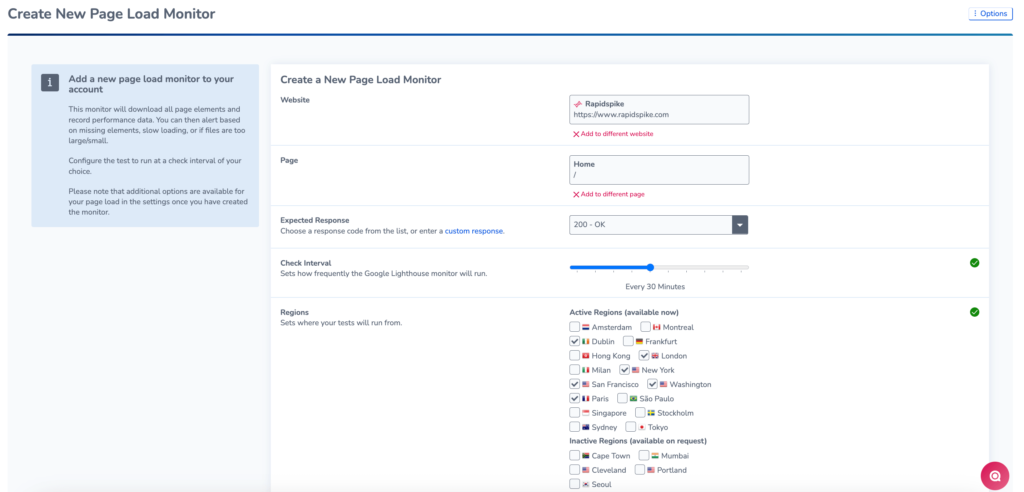
This will open up the customisation options for your new monitor. You can customise the monitor to run in multiple test regions and change how frequently you would like the Page Load Test to run.