Guide to Dashboards
Dashboards allow you to see all of your key monitors in one place, for all of your websites. Your Dashboards are divided into key sections
- Overview
- Live Issues
- Alert History
- Reliability
- Performance
- Security
- Saved Dashboards
Dashboards can give you a visual overview of your monitors; you can customise the dashboard view and put them into TV mode.
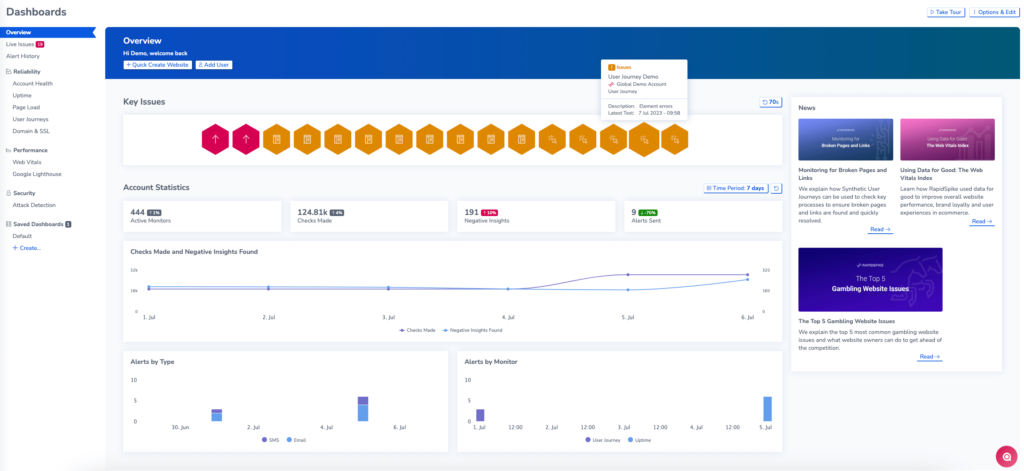
Overview tab
The overview tab is the first page you see when logging into your account. Here you can see summary information about your account, including:
- Key issues – Monitors that are currently failing and tests with errors. Hover over each icon to see more information.
- Account Statistics – See basic statistics about your active monitors, negative insights and alerts
- News – See the latest updates and blog posts from RapidSpike
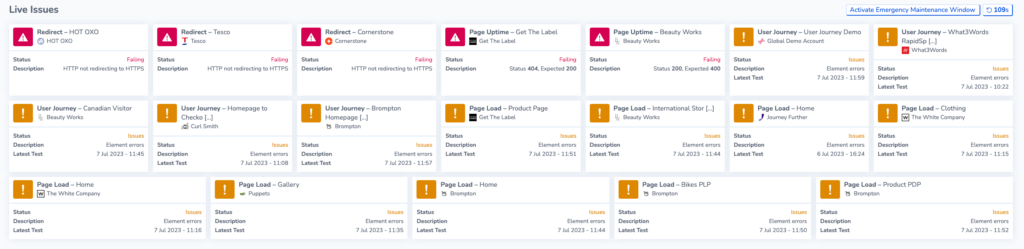
Live Issues
The Live Issues tab provides an overview of all your monitors across your account which are either failing or encountering errors. This includes status information as well as a description of the issue.
You can activate a Emergency Maintenance Window to pause all monitors on your account for 15 minutes.
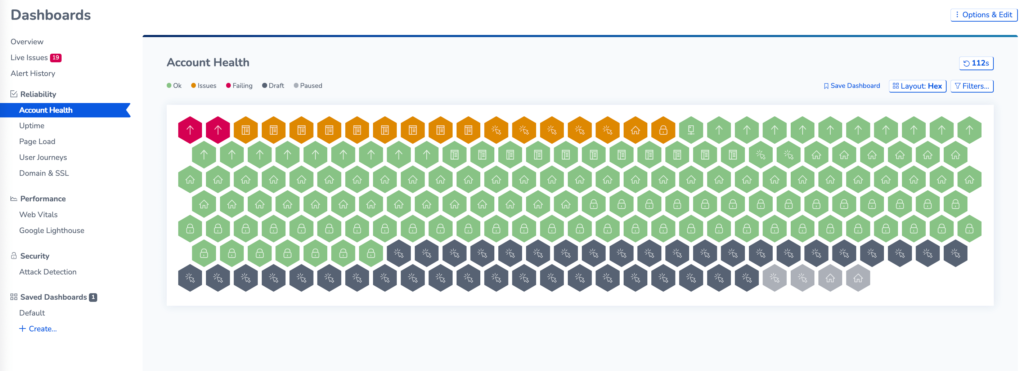
Reliability
These dashboards give you an overview of your site’s reliability:
- Account Health
- Uptime Dashboard
- Page Load Dashboard
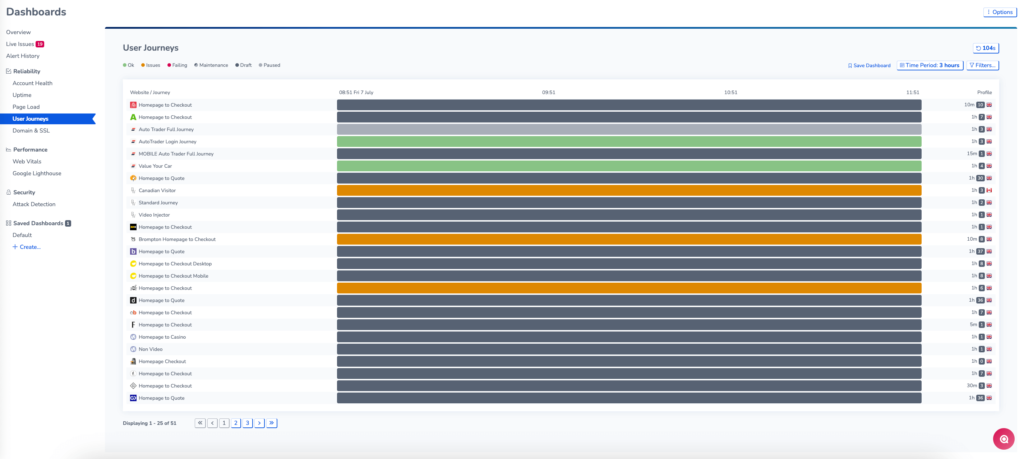
- User Journeys Dashboard
- Domain and SSL
For Account Health, Uptime and Domain and SSL Dashboards, select Layout to switch the dashboard design. You can switch between ‘Hex View’ and ‘Simple View’. Domain and SSL also contain a ‘’Detailed View’ with more details visible at a glance.
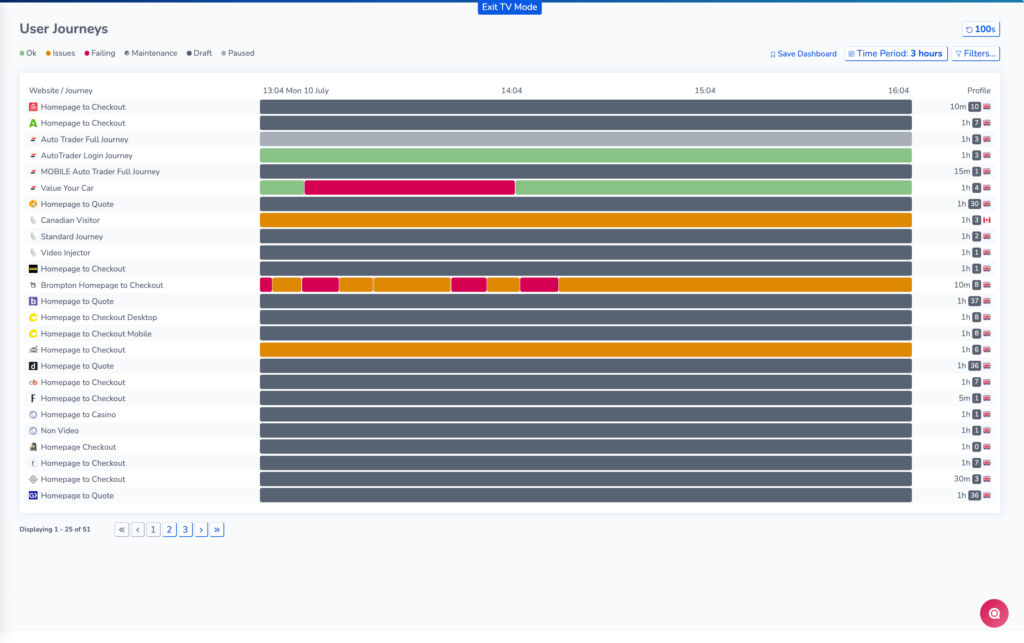
For Page Load and User Journeys, you can view timelines for all of your Page Load Monitors or User Journeys at once. You can filter results and change the Time Period visible.
You can also navigate to test results by clicking on the coloured bar.
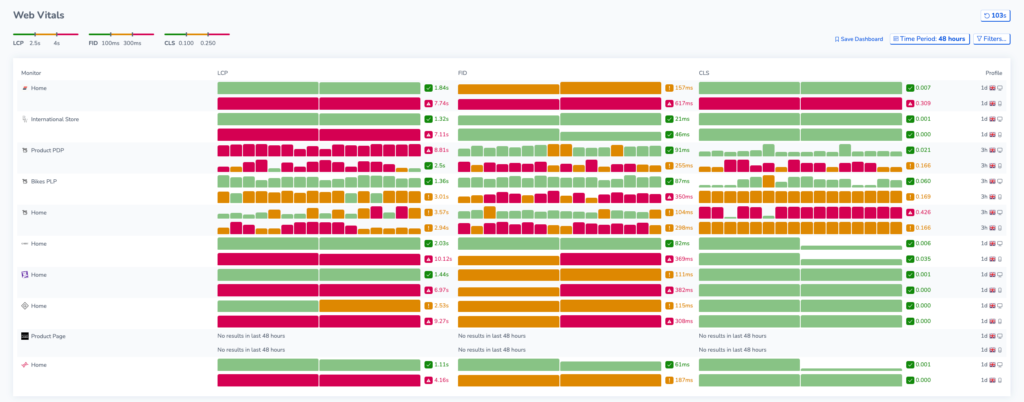
Performance
The Performance Dashboards display an overview of performance monitors on your website. This includes
- Viewing your Web Vitals at a glance: See bar graphs of your Web Vitals Metrics over time. You can adjust the Time Period using the button at the top of the page.
- Google Lighthouse Summary results.
TV Mode
Go to Options > TV mode for a full-screen view of your dashboards.
Saved Dashboards
You can create customized dashboards; see saved dashboards.