Set up an Uptime Monitor
Introduction
An uptime Monitor is one of the most basic yet crucial checks you can have for your website. RapidSpike allows you to continuously monitor individual pages on your website. Uptime performs a simple check to ensure your website is accessible and records the details of downtime events.
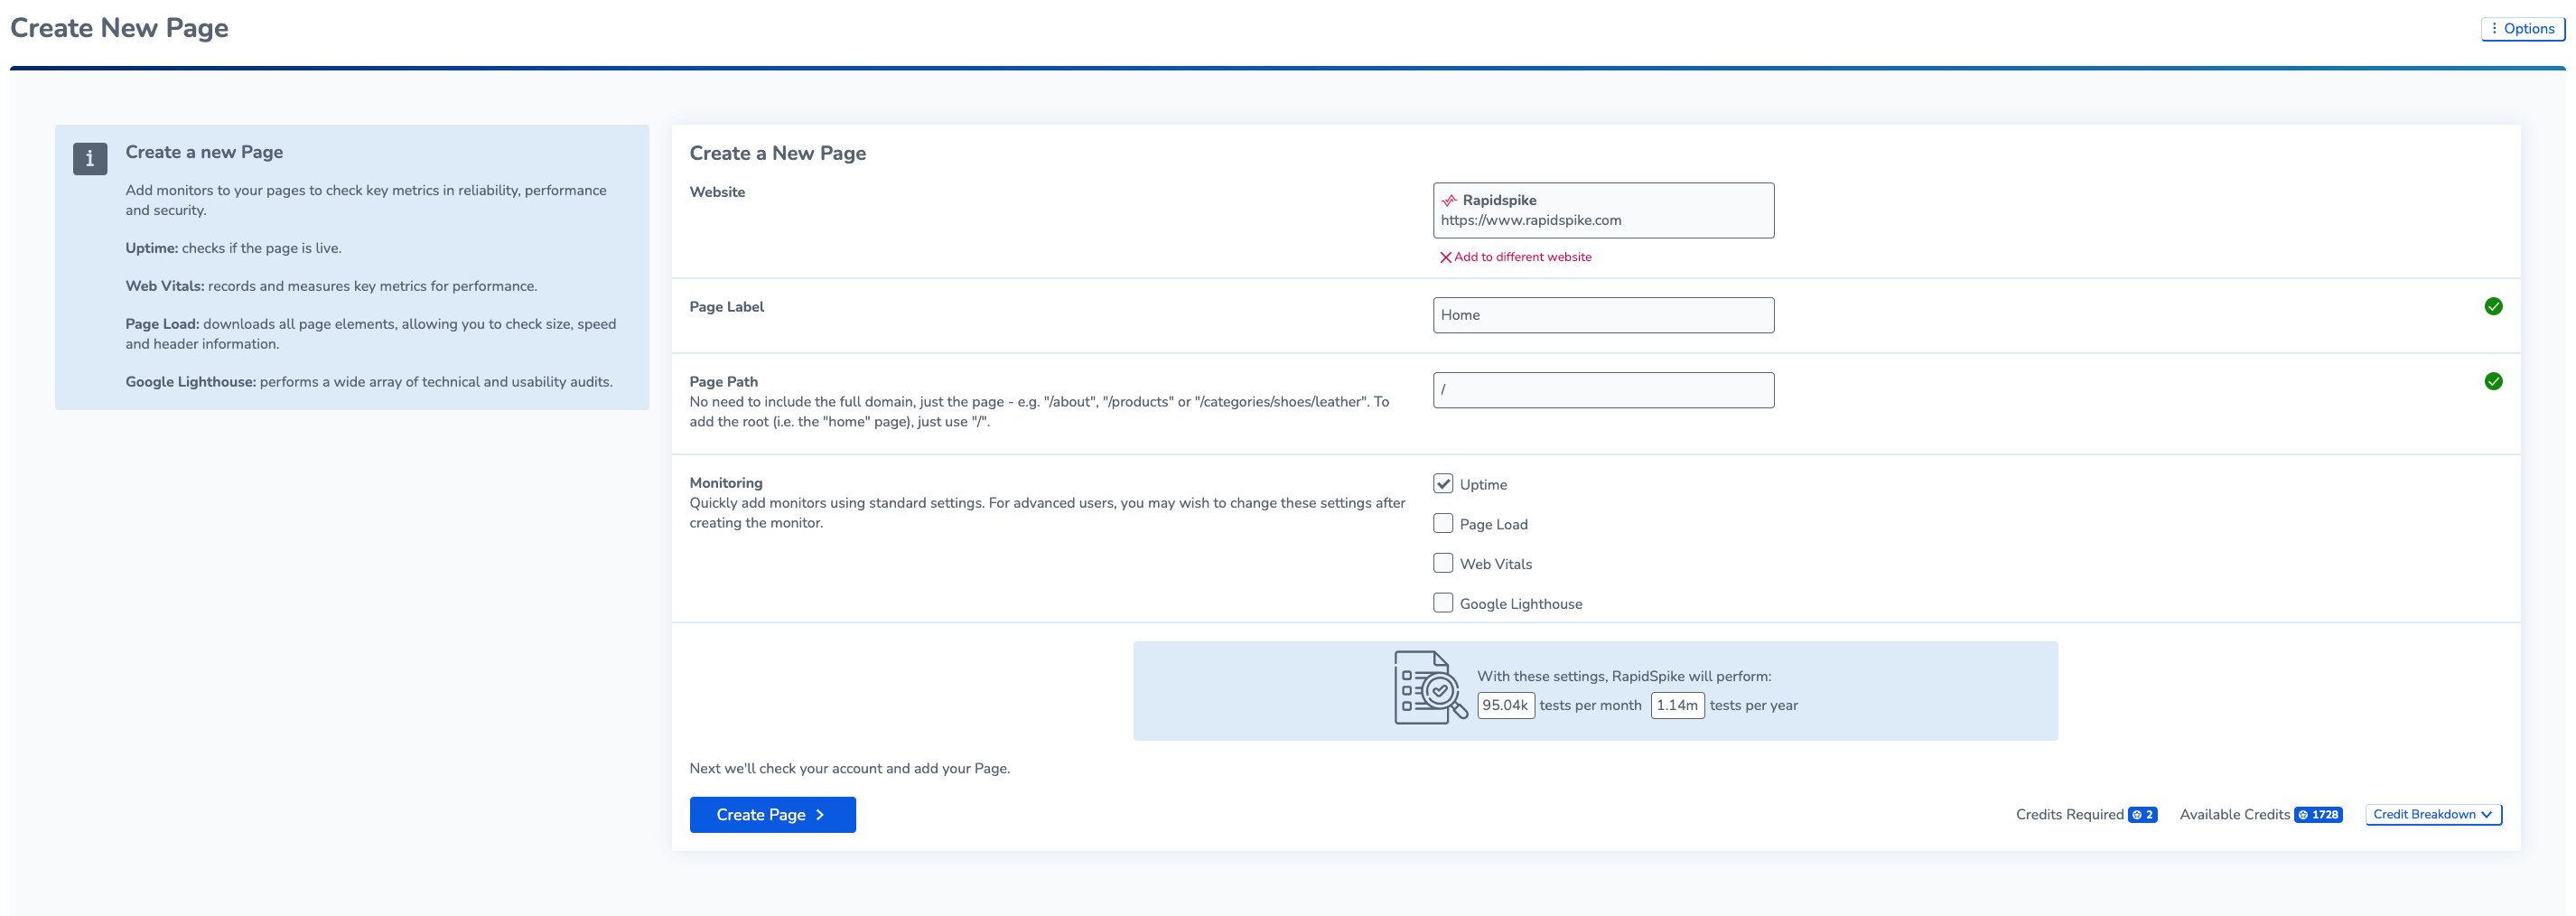
Add an uptime monitor to a new page
The simplest method to create a new Uptime monitor is to add a new page in Rapidspike. By default, adding a new page automatically sets up an uptime monitor.
Add an uptime monitor to an existing page
You may also want to add an uptime monitor to an existing page. There are two ways to do this:
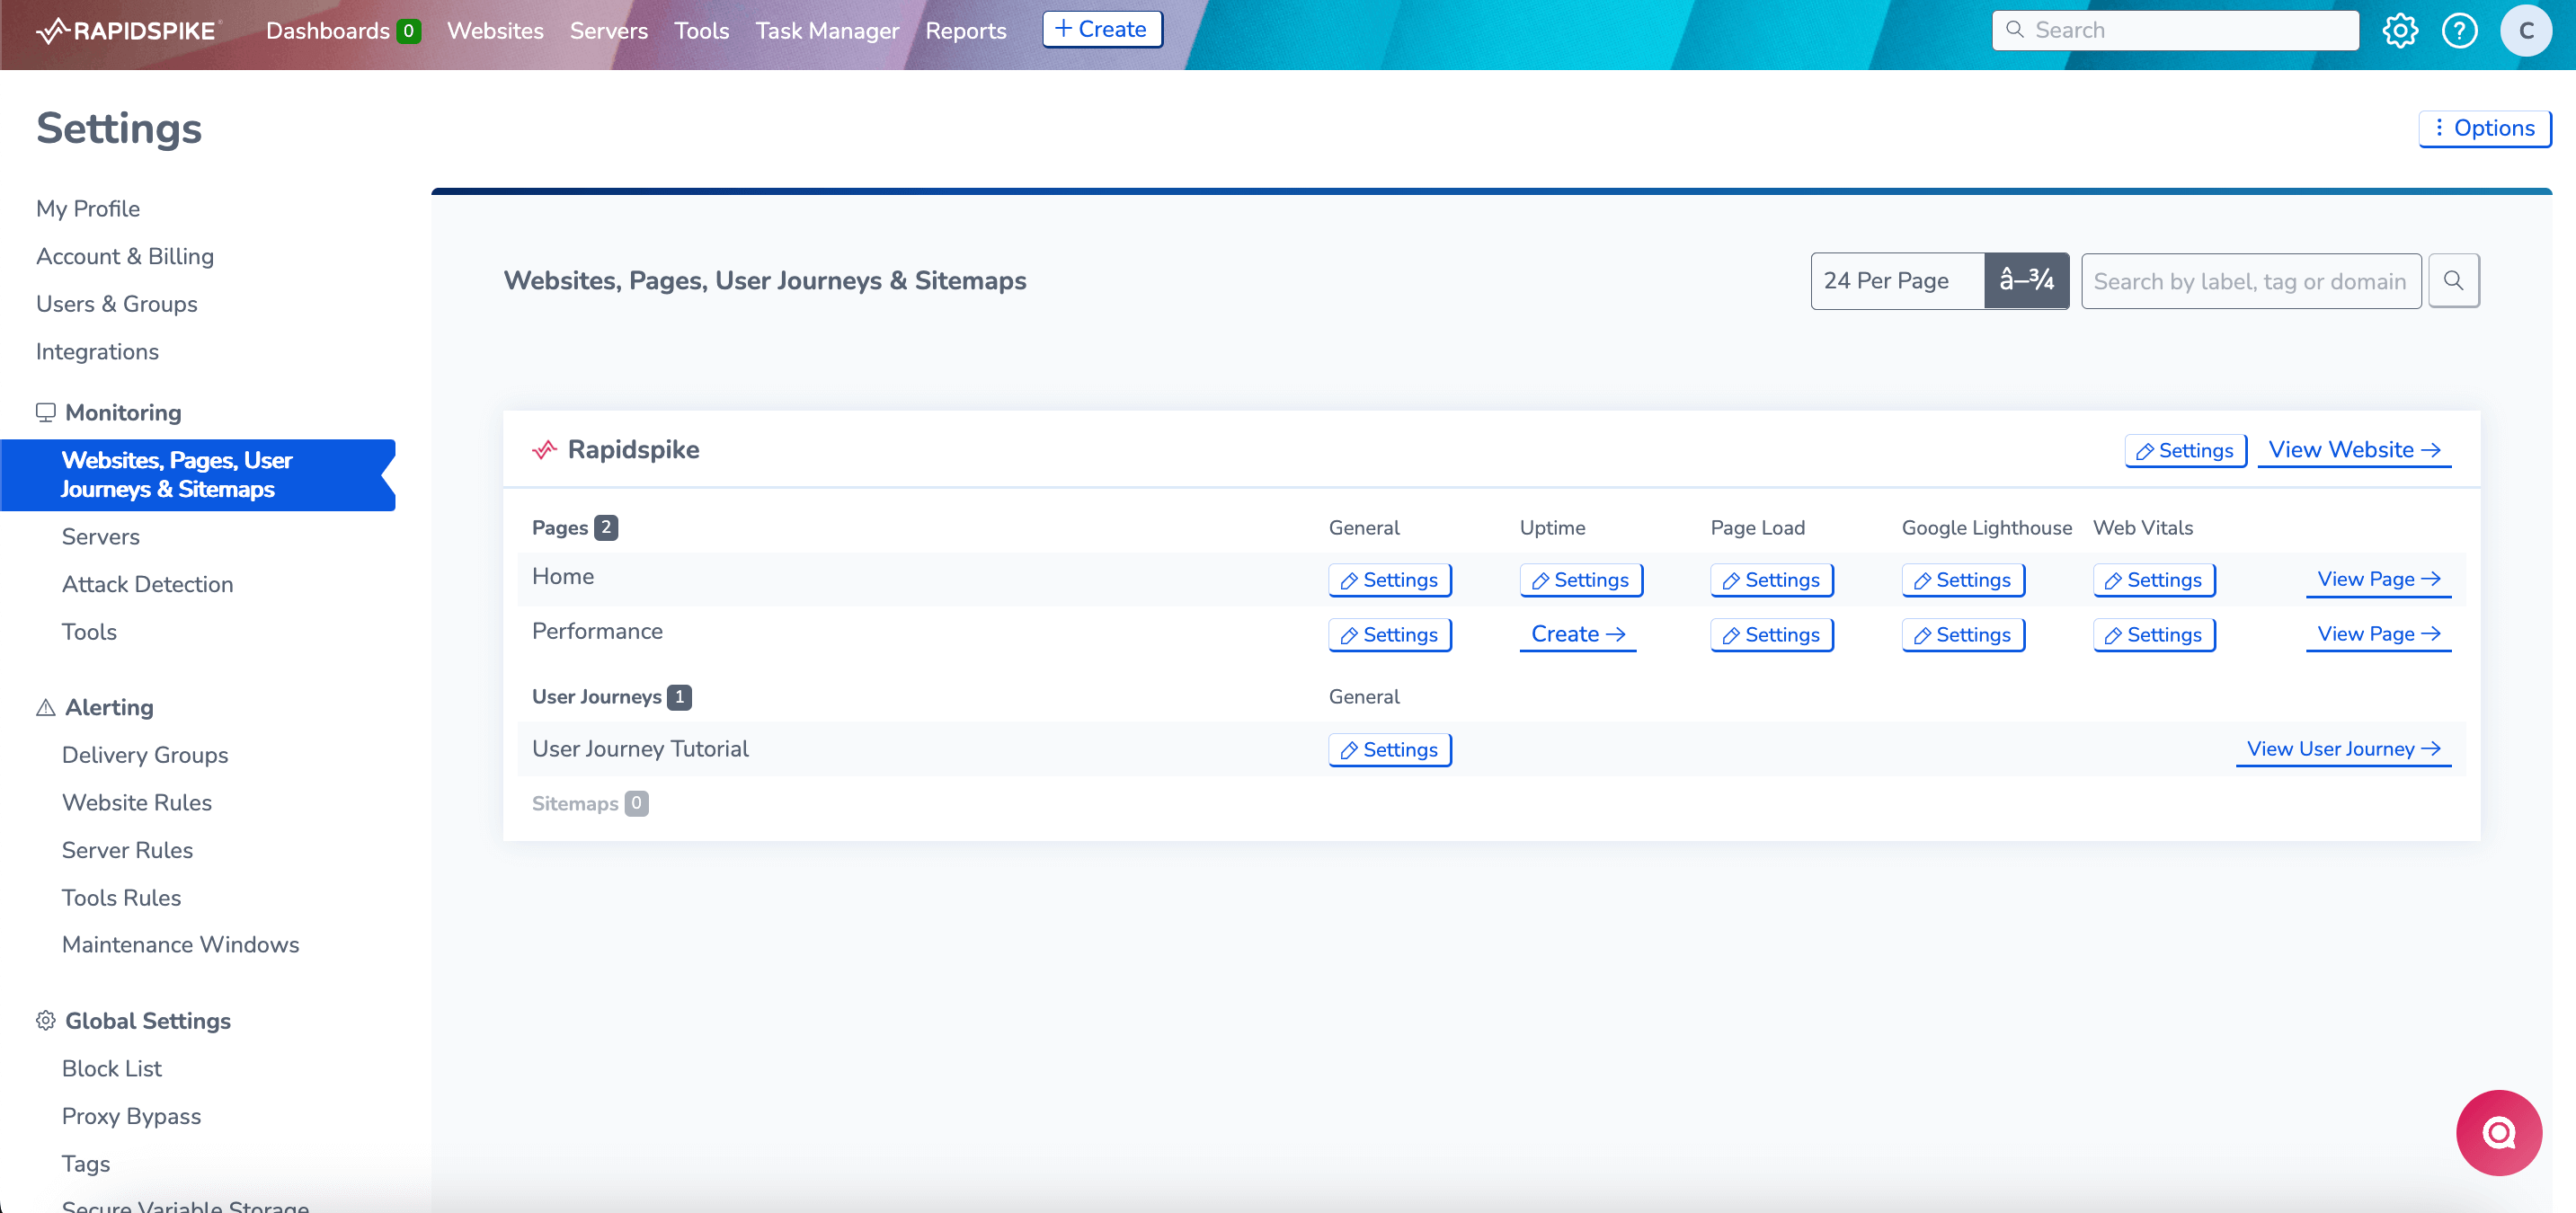
1. If the page does not yet have an Uptime monitor configured, navigate to Settings > Websites, Pages, User Journeys & Sitemaps and find the page where you want to add the new monitor. Click Create.
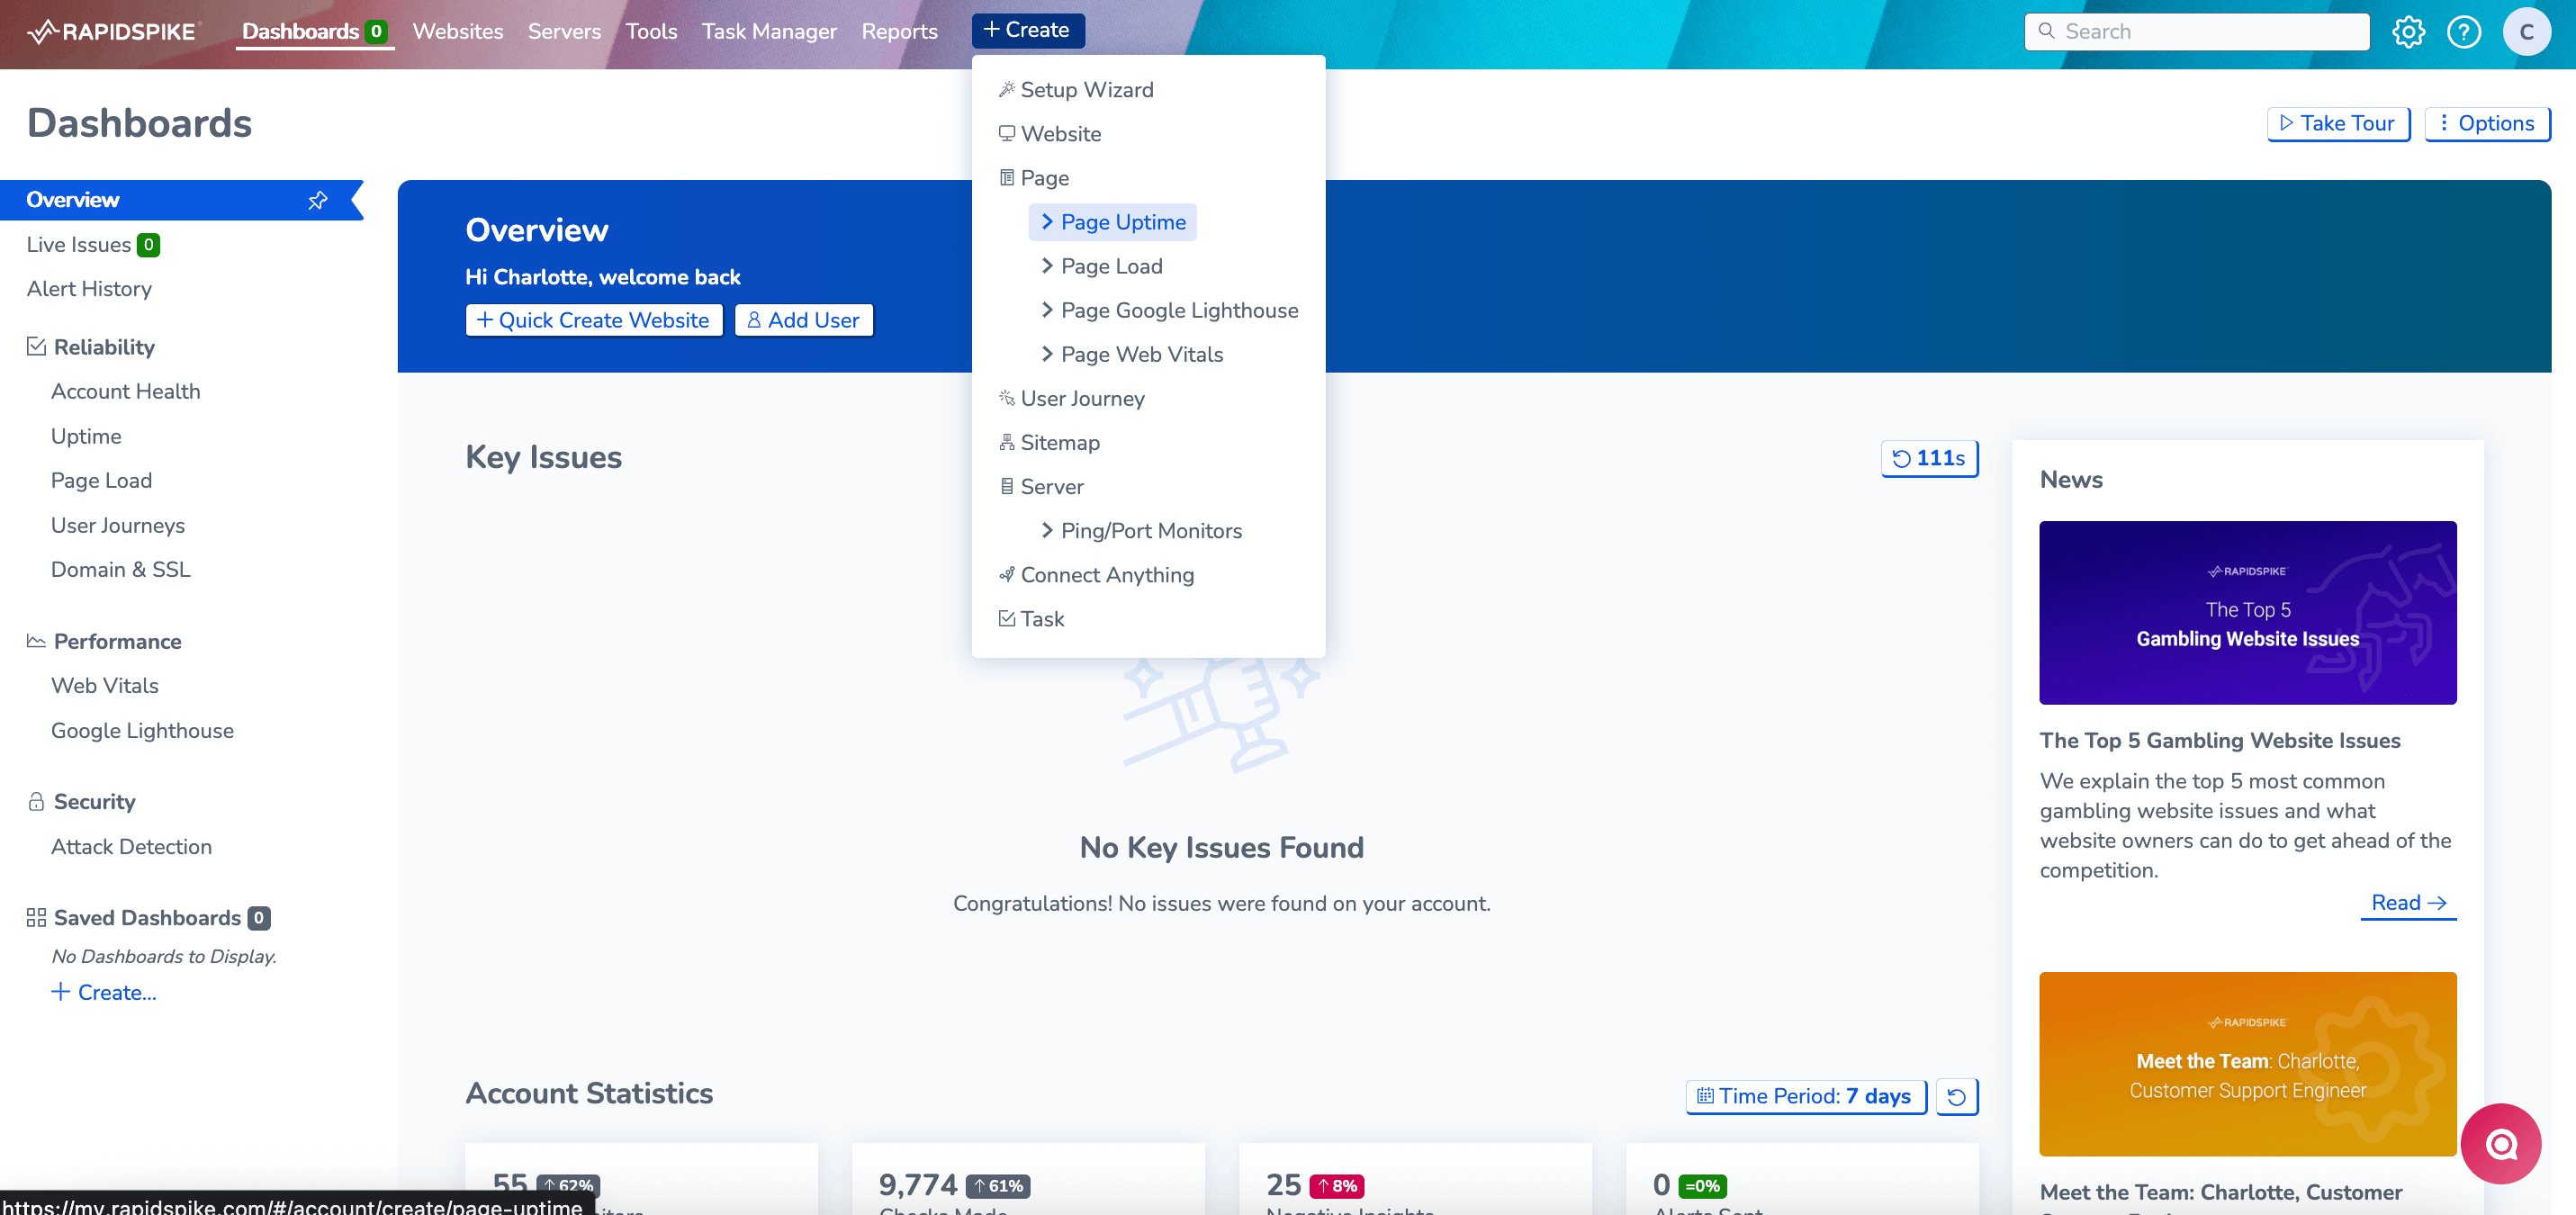
2. Click the Create button at the top of the page and select Page Uptime.
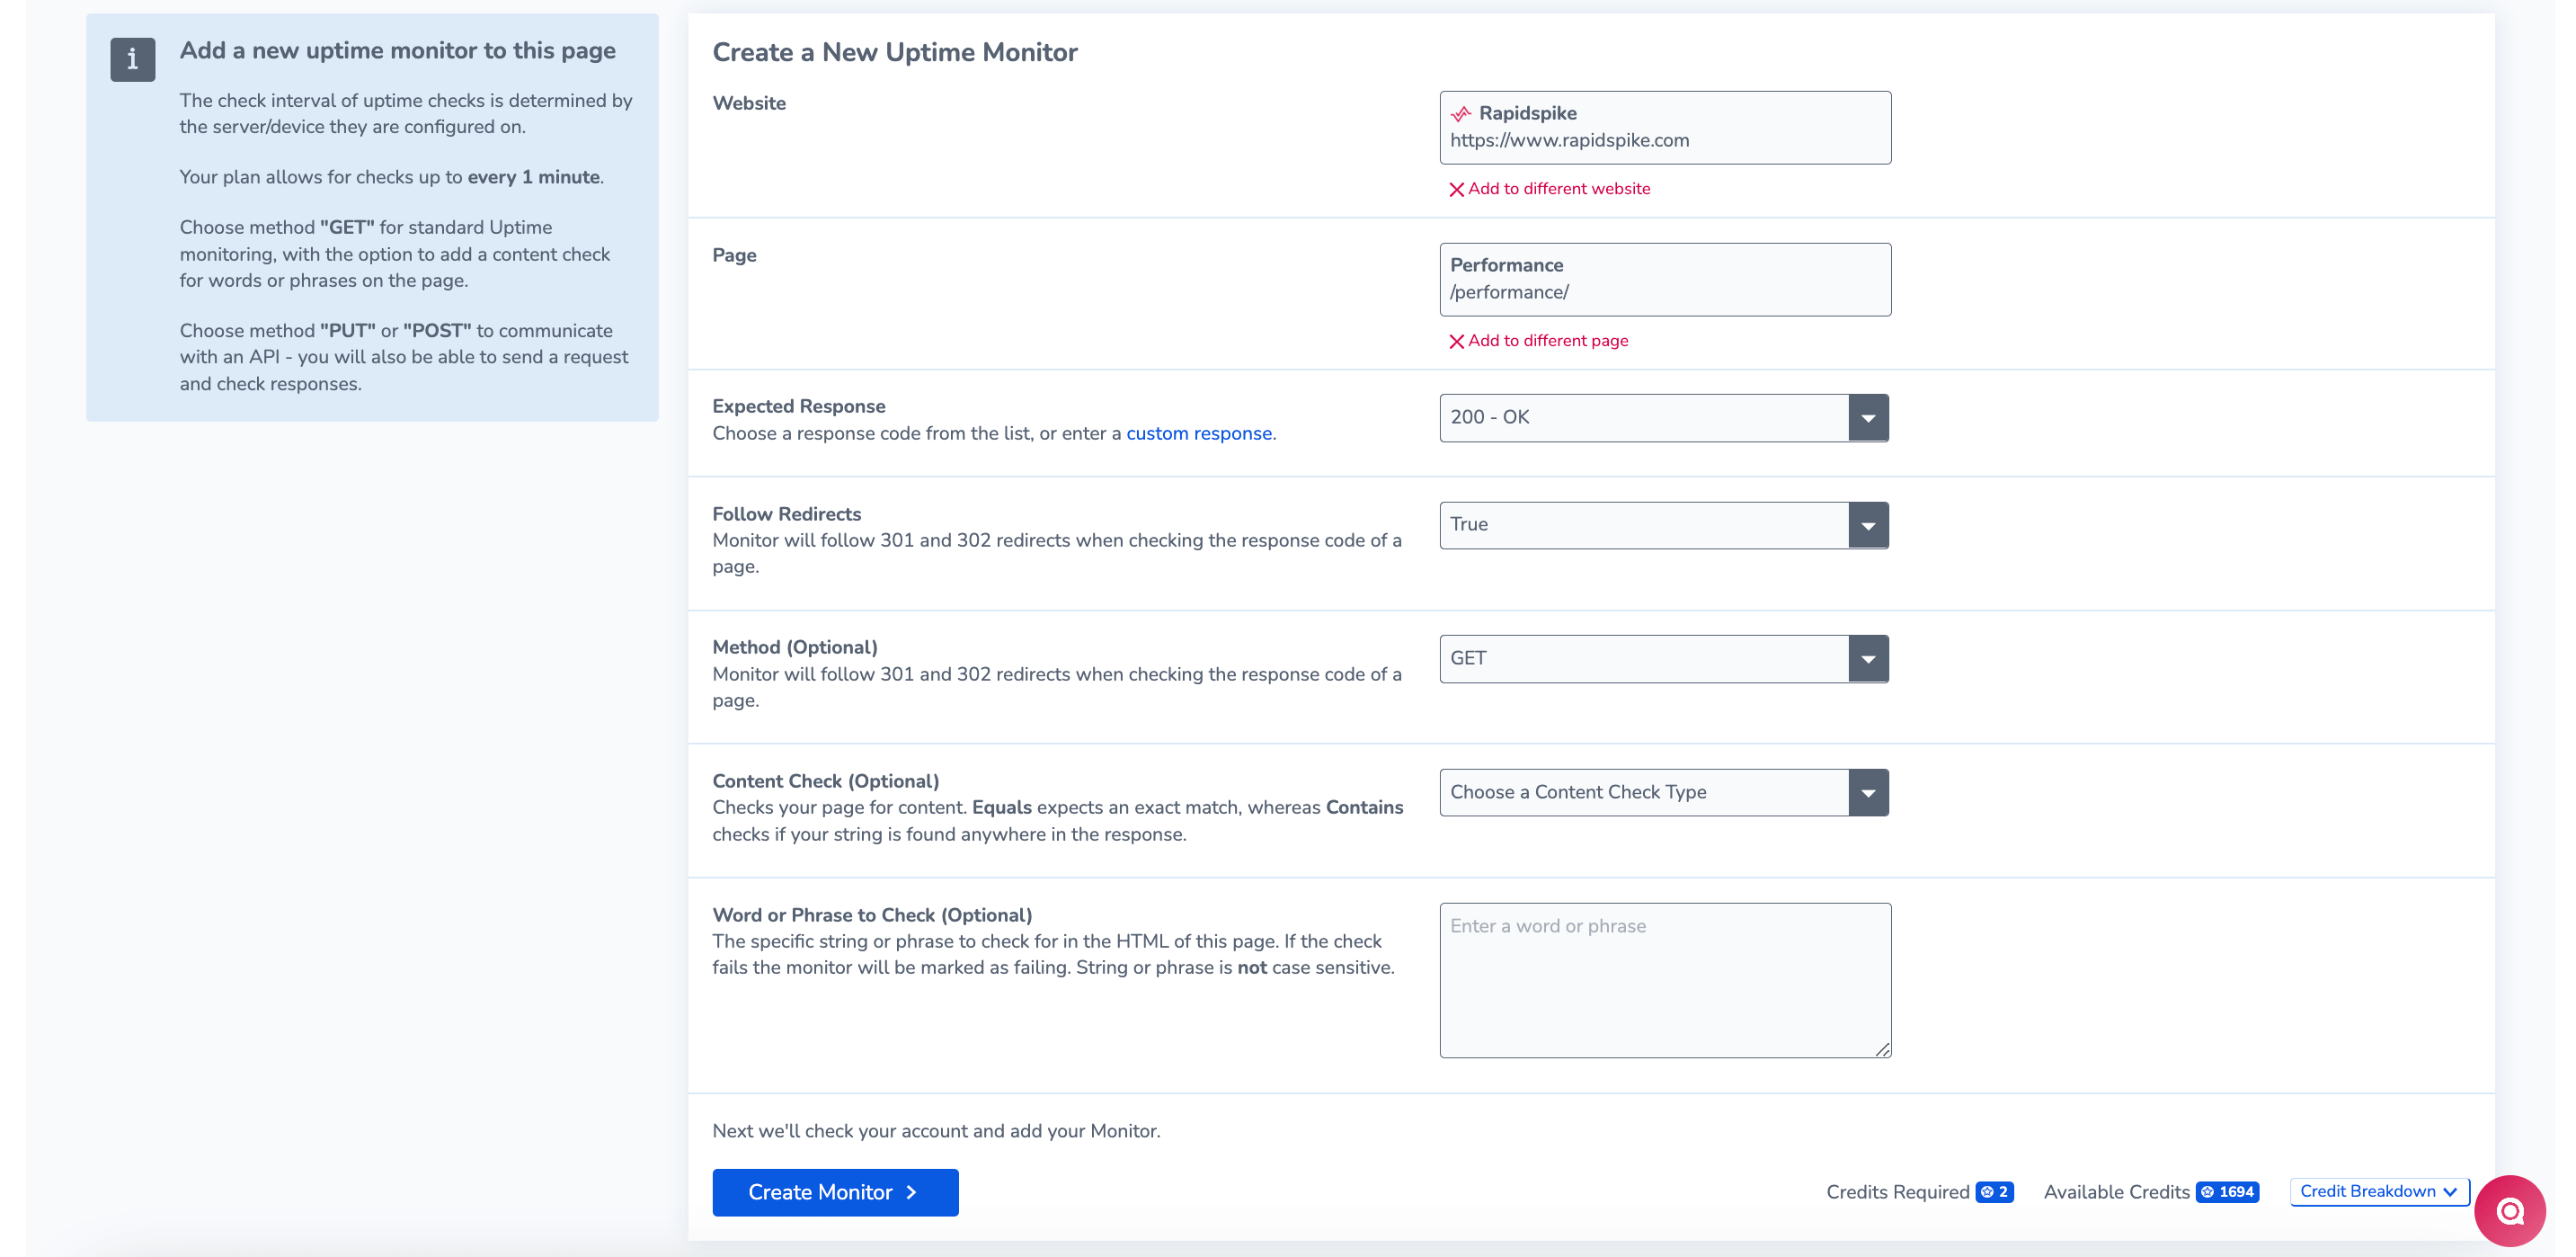
Customise your Uptime Monitor
This will bring up a set of options for configuring your uptime monitor. On this page, you can configure the monitor to fit your requirements. You can:
- Check for the correct status code
- Follow Redirects when checking the response code
- Set the expected HTTP response
- Set the HTTP method (e.g. GET or POST)
- Test for custom content in the HTML.