Analyse data from Page Load Monitors
RapidSpike’s Page Load monitor periodically checks your webpage by rendering your page in a real browser and monitoring various elements on your page, including scripts, images and fonts. To get started with Page Load, you can add a new monitor or edit an existing monitor for a page on your website.
View Page Load Test Results in RapidSpike
Go to Websites > Pages, select the page you want to check, and then select Page Load. This will bring up the latest test result for your Page Load Monitor. You can click Test History to view historical test result data for the previous 30 days.
Results
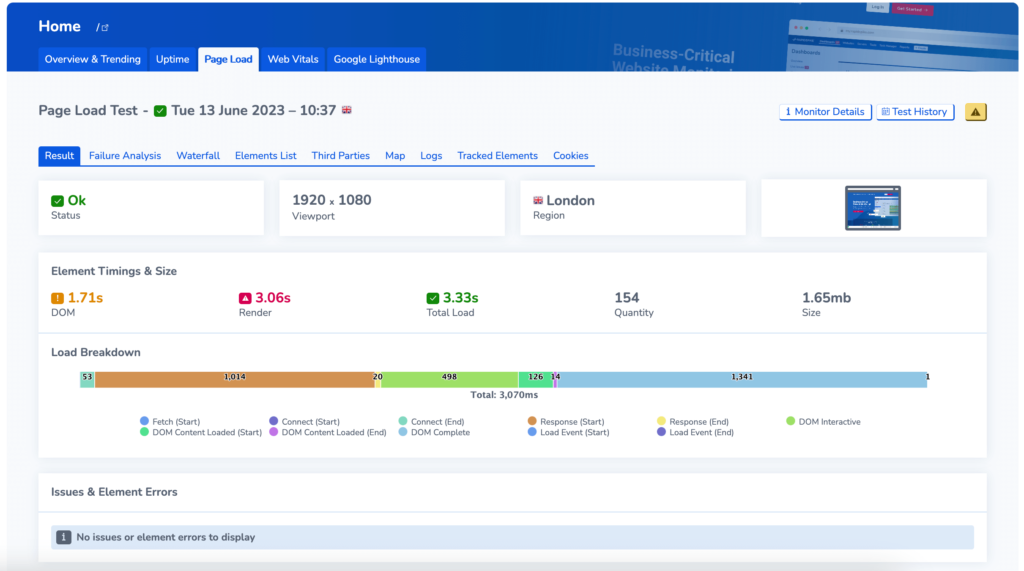
Go to the results tab for an overview of your Page Load results. Here you can view details about the Element Timings and Size; this includes DOM, Render and Total Load time, as well as the size and quantity of elements on the page. This also includes a Load Breakdown chart.
There is a section at the bottom of the page where you will find information about Issues and element errors on the page.
Failure Analysis
Go to the Failure Analysis to review Page Load Failures in depth and compare previous test results. This is divided into four sections:
- Visual
- Elements
- Waterfall
- Browser Log
Waterfall
The Waterfall chart is a visual representation of the loading time and sequence of resources on your web page. It provides a detailed overview of how each element, such as HTML, CSS, JavaScript files, images, and other assets, are fetched and loaded by a web browser when accessing your web page.
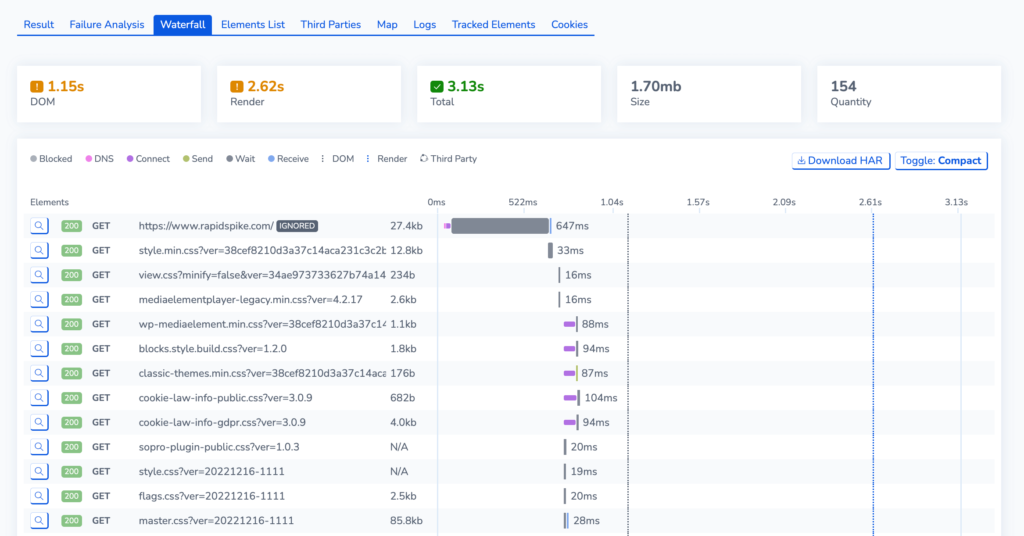
This allows you to identify bottlenecks, optimize resource loading, and understand the impact of various elements on the overall page performance.
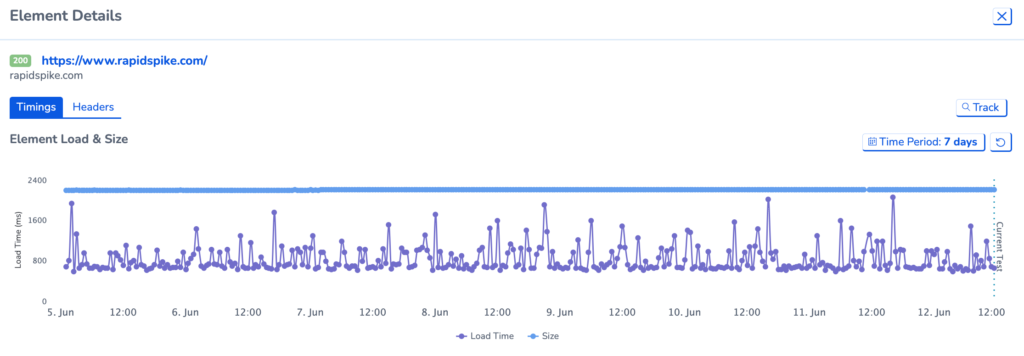
You can also click the magnifying glass icon (explore this element) to analyse individual elements on the page. This includes Element timings, Element Load and Size, and Request and Response Headers. This also allows you to track an element (see below).
Tracked Elements
Navigate to the Tracked Elements tab to view data for individual elements.
Elements List
The Elements List tab provides a comprehensive overview of all elements loaded on your page. Here, you can access key details such as the HTML Method, Type (e.g. JavaScript, HTML or CSS), Load time, File Size, Status, and the precise location from where each element is loading.
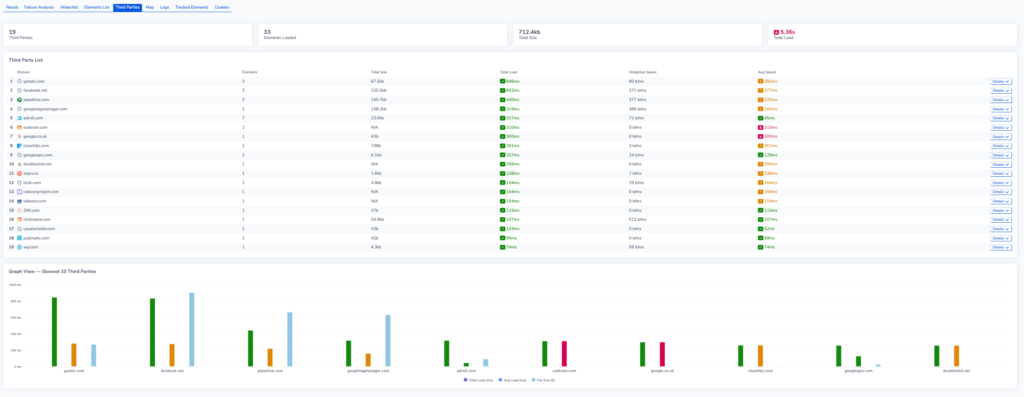
Third Parties
The Third Parties tab contains information about third-party loading on your site.
This includes the number of third parties that are loaded on the page, the number of elements loaded from these third parties, the total size, and the total load. It also lists the third parties involved. There is a graph view for the slowest third parties impacting your page.
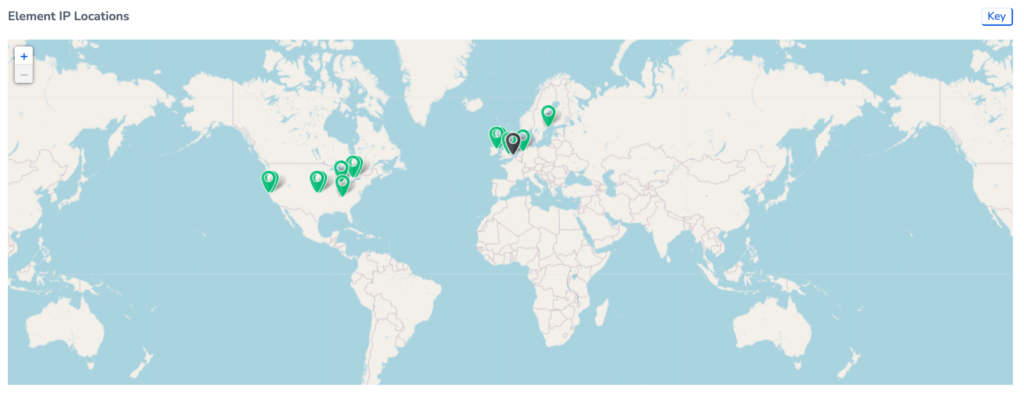
Maps
On the Maps tab, you can see a visual representation of what IP Locations the different elements on your site are loading from.
Logs
View Browser and Server Logs for the page by going to the logs tab.
Cookies
On the cookies tab, you can view a log of the cookies loaded on your page, including the Domain, Path and Expiry.