The World’s #1 Synthetic Monitoring Tool
Our synthetic monitoring checks that every part of your customer user journey, user experience & key processes are running smoothly – all day, every day to minimise disruptions to your business.
See how it works:
What is Synthetic Monitoring?
The Synthetic Monitoring of User Journeys emulates common paths that your customers take. They behave like a “synthetic” user, interacting with your website and an actual browser just like a real user does.
Transaction monitoring is only basic information, and you cannot guarantee your real user monitoring is watching specific processes 24/7. With RapidSpike synthetic monitoring, you can ensure you understand more about your application performance and how to fix it.
1
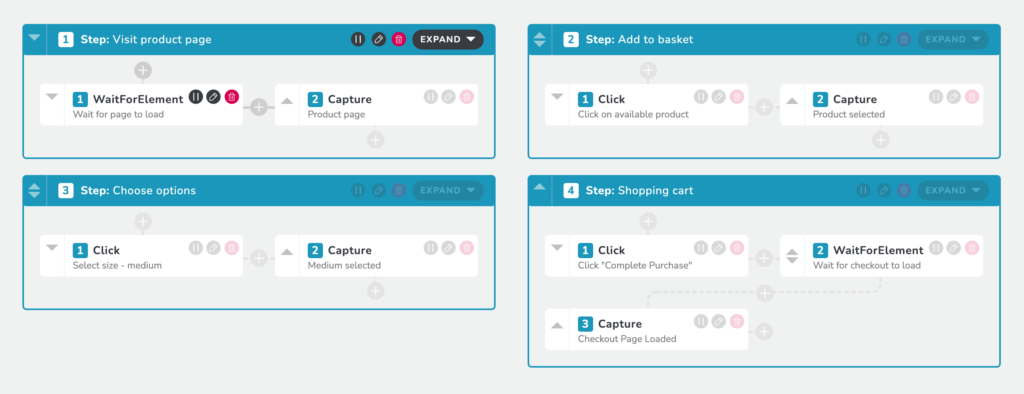
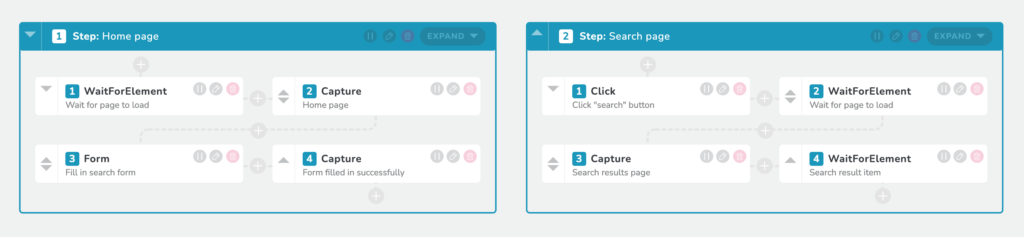
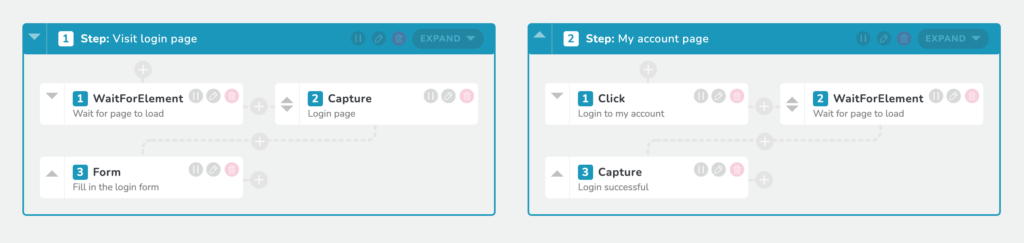
Create simple tests run in a real browser with scripts of actions that follow your critical buying processes, such as:
- Searching for a product
- Logging in to an account
- Adding to the basket
- Making a payment
… Or any other critical business transaction.
2
Simulate real users at global geographic locations from the cloud, at 5-minute intervals, following that critical process.

3
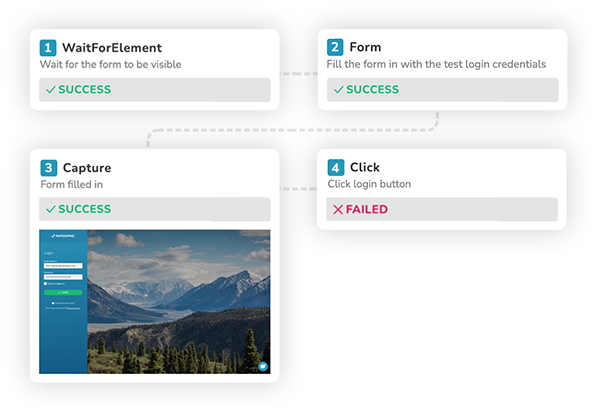
Find and fix an issue immediately if something goes wrong.
- Reliability – The buying process has an availability issue
- Performance – Detect key page, element or third party user-facing issues
- Security – If some tries to hack your website and payments
Find and Fix Issues Affecting Your Customers
Reputation is everything 88% of customers leave sites after a bad digital experience.
RapidSpike’s user journeys protect your complex transactions and report potential performance issues – even those long-term trends that real user traffic might miss.
Quickly learn about problems that might impact your capacity to improve your end-user experience and conversions.
Improve Your Website’s Performance
Page Speed Matters Conversions drop by 7% per 1 second of load time delay.
Shave seconds off your load times by performance monitoring your key critical pages, user journeys and the reasons for any issues and breaking service level agreements.
Configure alerts to fire as soon as request and response times start to slow down – so you can react to failing performance before it affects your revenue and keeps your third party vendors accountable.
Active Monitoring & Metrics 24/7
Capture thousands of data points on an actual browser for each step of your journey, building more detailed insights than any other tool on the market.
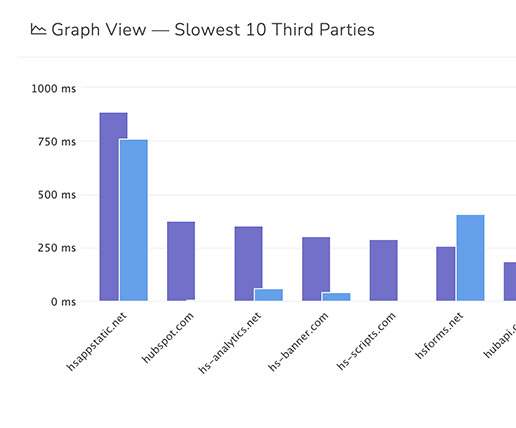
Discover third party issues affecting customer experience and critical business transactions, trending their load speed over time at any time of day.
Isolate elements by type – audit cookies, spot blocking Javascript, optimise images and identify slow fonts.

“Our relationship with RapidSpike is excellent. They are responsive and supportive.”
Neilson use RapidSpike to test their core processes 24 hours a day, every day, for a total peace of mind.
Monitor the key processes you care about
Choose any browser user journey you want to emulate and set it up easily and quickly using our script builder – or we can do it for you.
Understand the Bigger Picture
Utilise a full suite of synthetic monitoring tools for understanding every detail of your crucial business processes.

Powered by Selenium
We combine industry-leading automation, a user-friendly interface and our world-class alerting system.
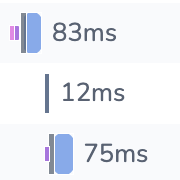
Detailed waterfall
Data-rich visualisation for every page element, including load time breakdown and headers.

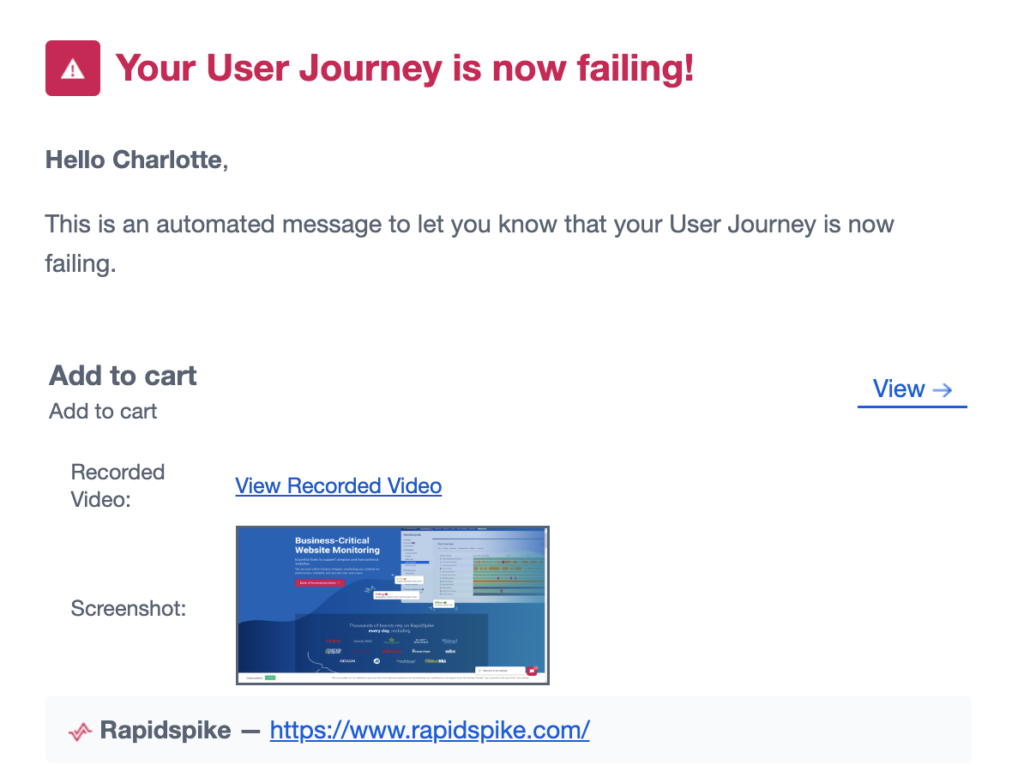
Video playback
Record a browser video of your critical process and content load as it happens, see exactly where issues occur.
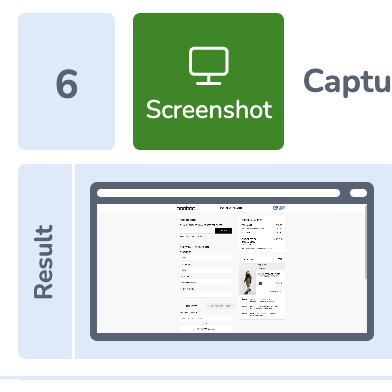
Page screenshots
Configure your monitoring script to capture screenshots of actual user interactions.
Third party tracking
See how third parties perform over time, as well as their impact on your page load.

Resource map
Visualise precisely where and how resources and critical endpoints load from locations worldwide.
Active monitoring of critical elements
Tag vital elements to trend their behaviour, size and load over time.
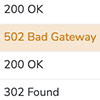
Error analysis
Understand why your processes fail, including full response headers and status codes.
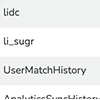
Cookie log
Comply with GDPR and audit all cookies stored during your journey.
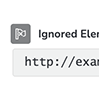
Ignore & block elements
Stop elements from triggering monitoring errors or loading at all to fine-tune your analysis.
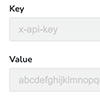
Custom headers
Set headers to flag your User Journey within your customer-facing application environment to learn more about your website issues
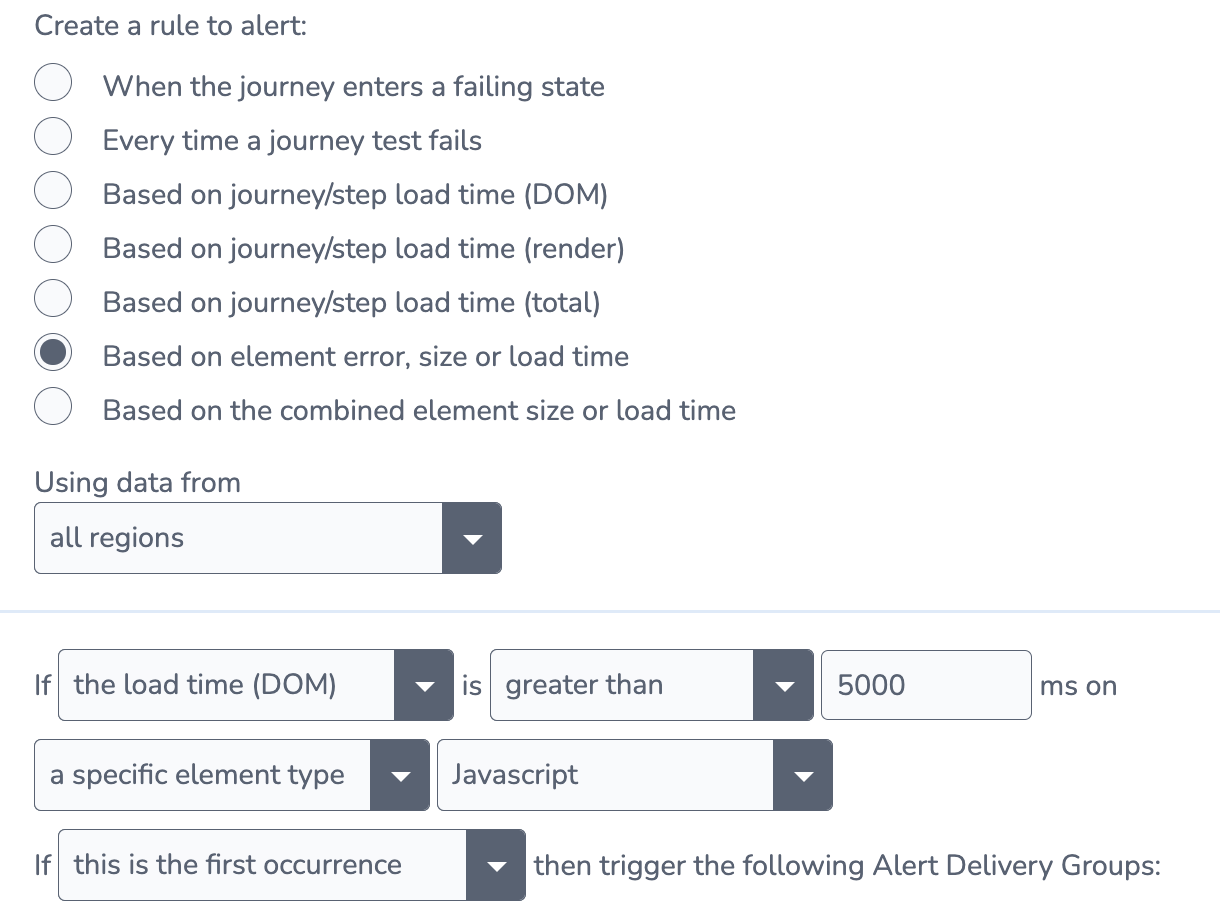
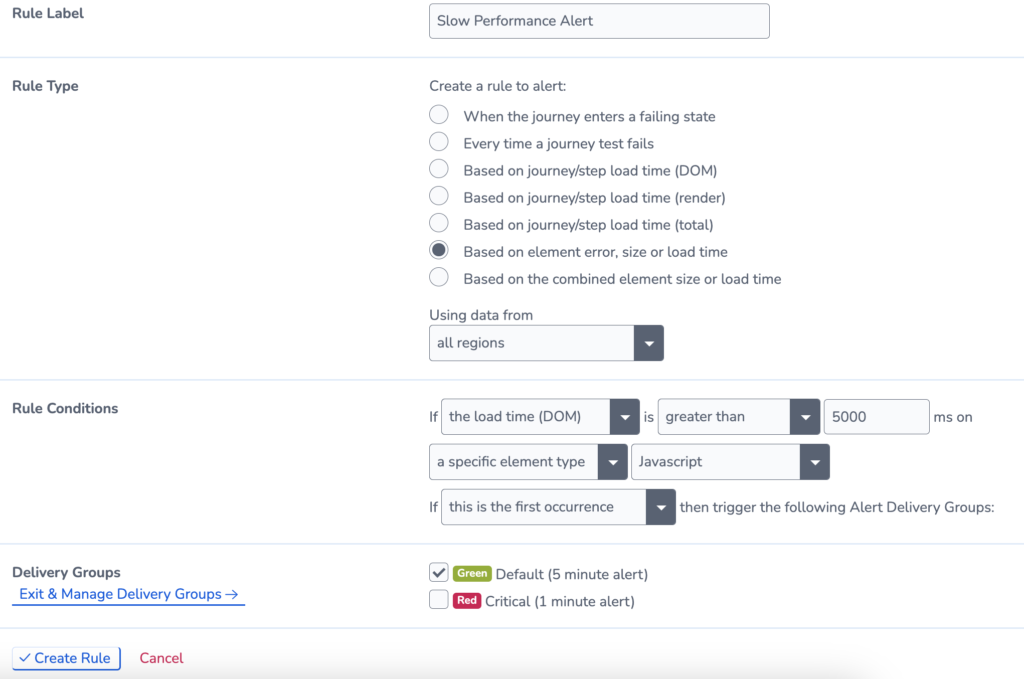
Customise your alerts
Fine-tune your user journey synthetic monitoring to alert you to what matters so you and your team’s responsiveness is the best your business can expect.
- Journey Failure
- Journey Load Time
- Page Load Time
- Element Load Time
- Element File Size
- Element Errors