The first code for the RapidSpike platform was written in January 2015 – it was a rudimentary test that pinged an individual IP address and recorded the response. This proof of concept – uptime monitoring in its purest form – was then thrown in the bin.
We knew it worked – so now let’s do it bigger. Better.
This first test was then followed by a more rigorous and stable testing infrastructure. Other tests followed – TCP, UDP, HTTP.
We started talking about features, about usability and performance. We thought about how the app would look, what sort of experience we wanted to give our users. The most popular idea was to break with the trend of bland white dashboards and to present people with a view of something bright, fresh and… pretty. Could an app be pretty?
In the first concept art we used a full-size background of a tropical beach and – thinking about the hell that can erupt when a vital server goes offline – one of the team quipped “Where would you rather be?”
Building a prototype
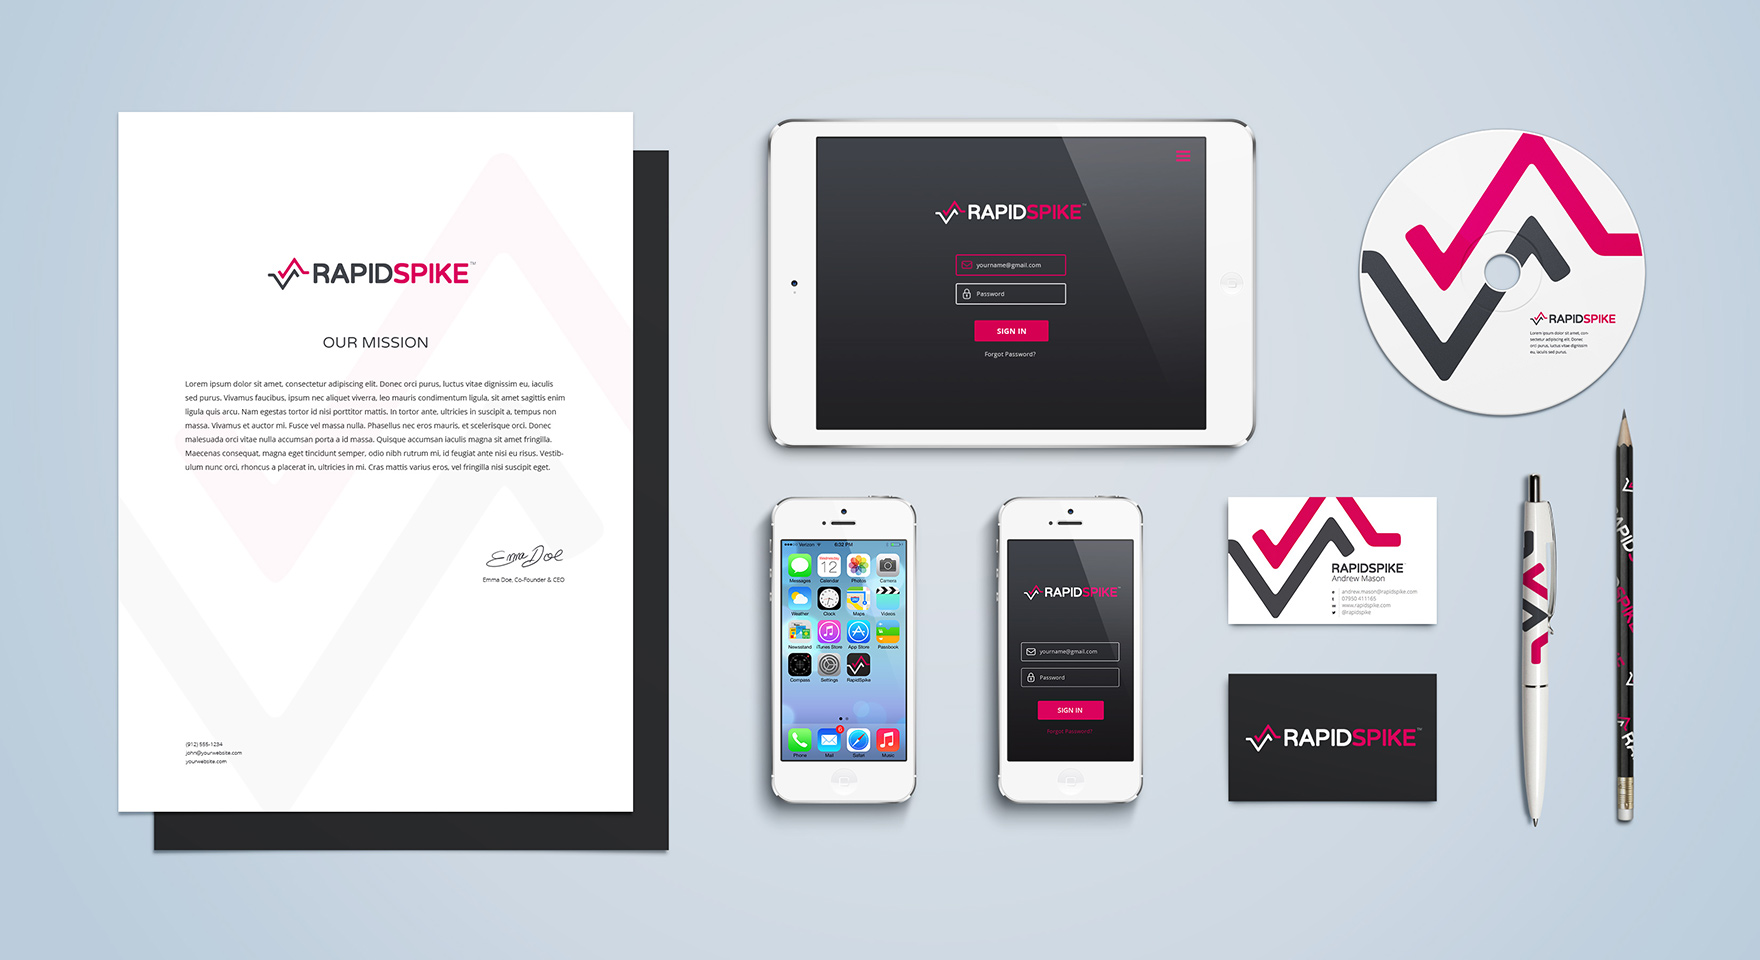
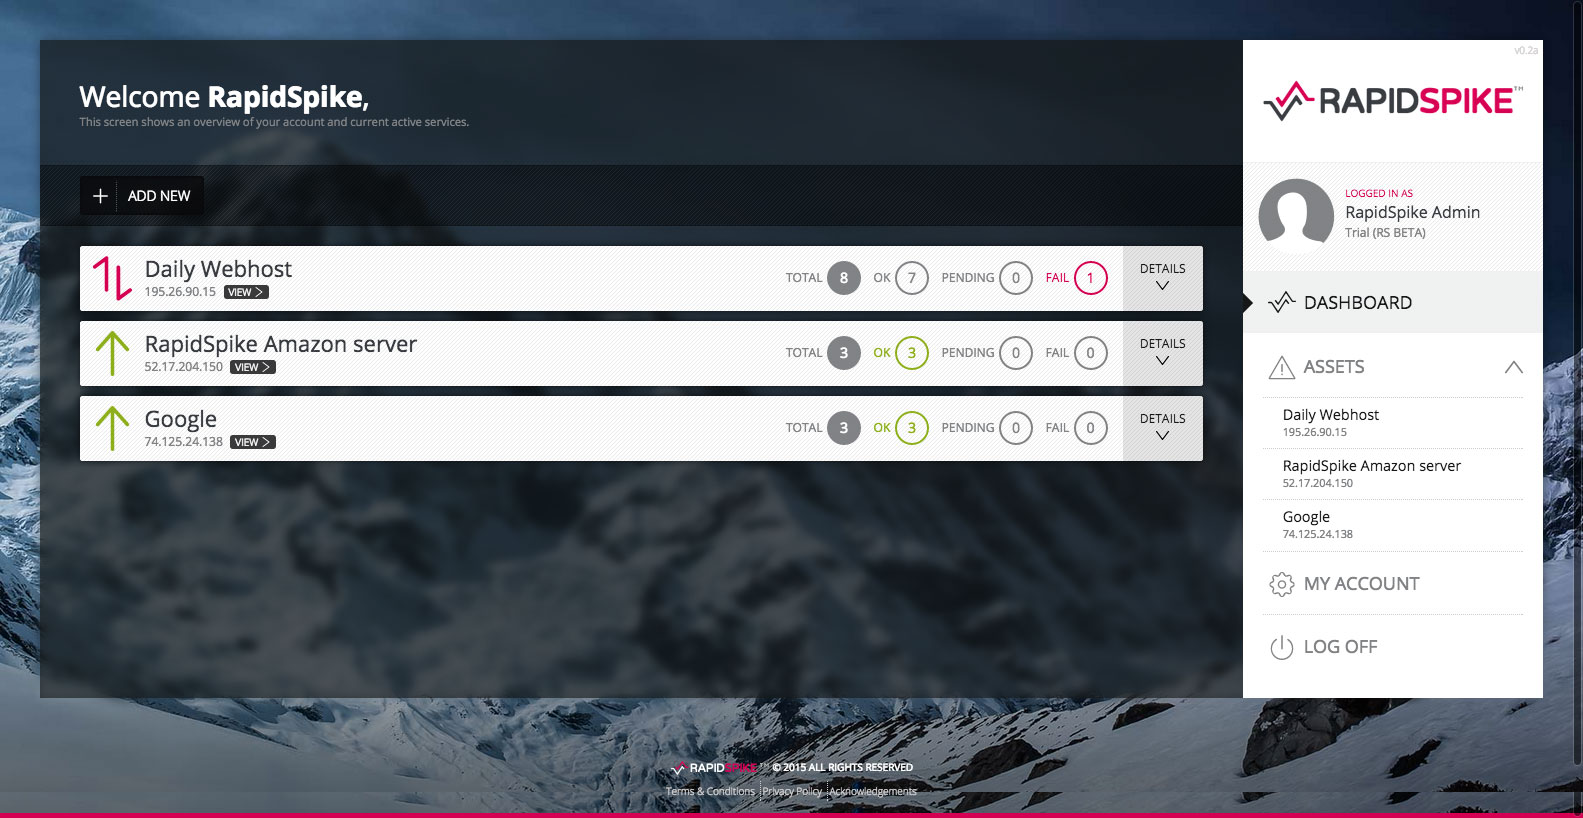
As winter moved to spring we had our RapidSpike brand, our first simple website and a working prototype of the app.
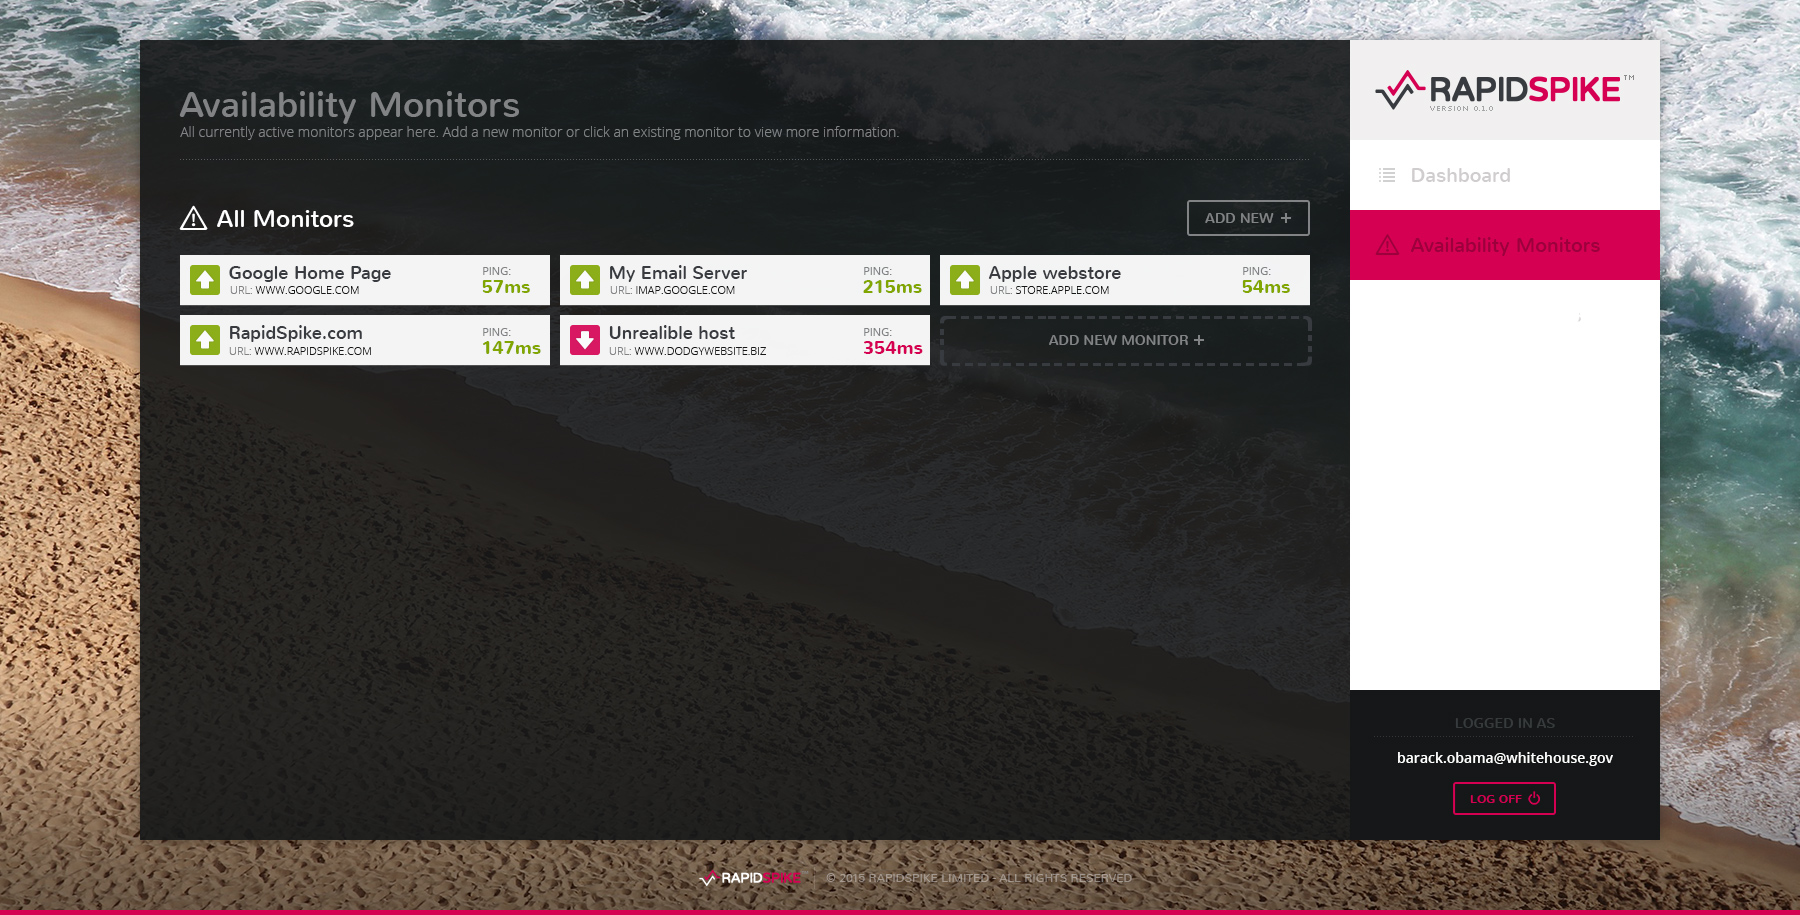
Built with Angularjs, the prototype enabled users to login and create their own tests, view the results and receive email alerts.
It worked great, it was elegant and simple. We all loved it. However conversations had moved to the subject of scalability, and we knew we had a problem:
Our prototype, like most uptime monitoring services out there, showed each monitor separately on the dashboard, with no relationship between them.
But small businesses might have a single server running lots of apps – like email, website(s) or ftp. This server is the lifeblood of their online infrastructure – running slow or going down would spell disaster.
A server is the lifeblood of a small online business. Downtime can be a disaster.
A single server needs testing in all sorts of different ways – ping, TCP (port checks), app checks, HTTP – website page checks.
Errors can occur at any level, but without knowing how the tests relate, an uptime monitor is just a mindless alarm. It could tell you something was wrong, but offer no overview, no analysis.
Our prototype just wouldn’t cut it.
We then considered larger businesses – these don’t often operate with a single server, but clusters of servers. Each box needs careful monitoring – the wrong open port could mean a vulnerability: data loss, public embarrassment, customer dissatisfaction…
With an infrastructure like this you need to be able to see a lot of data at a glance. Without a clear overview important things could be missed.
The prototype went in the bin.
A new direction – and an alpha
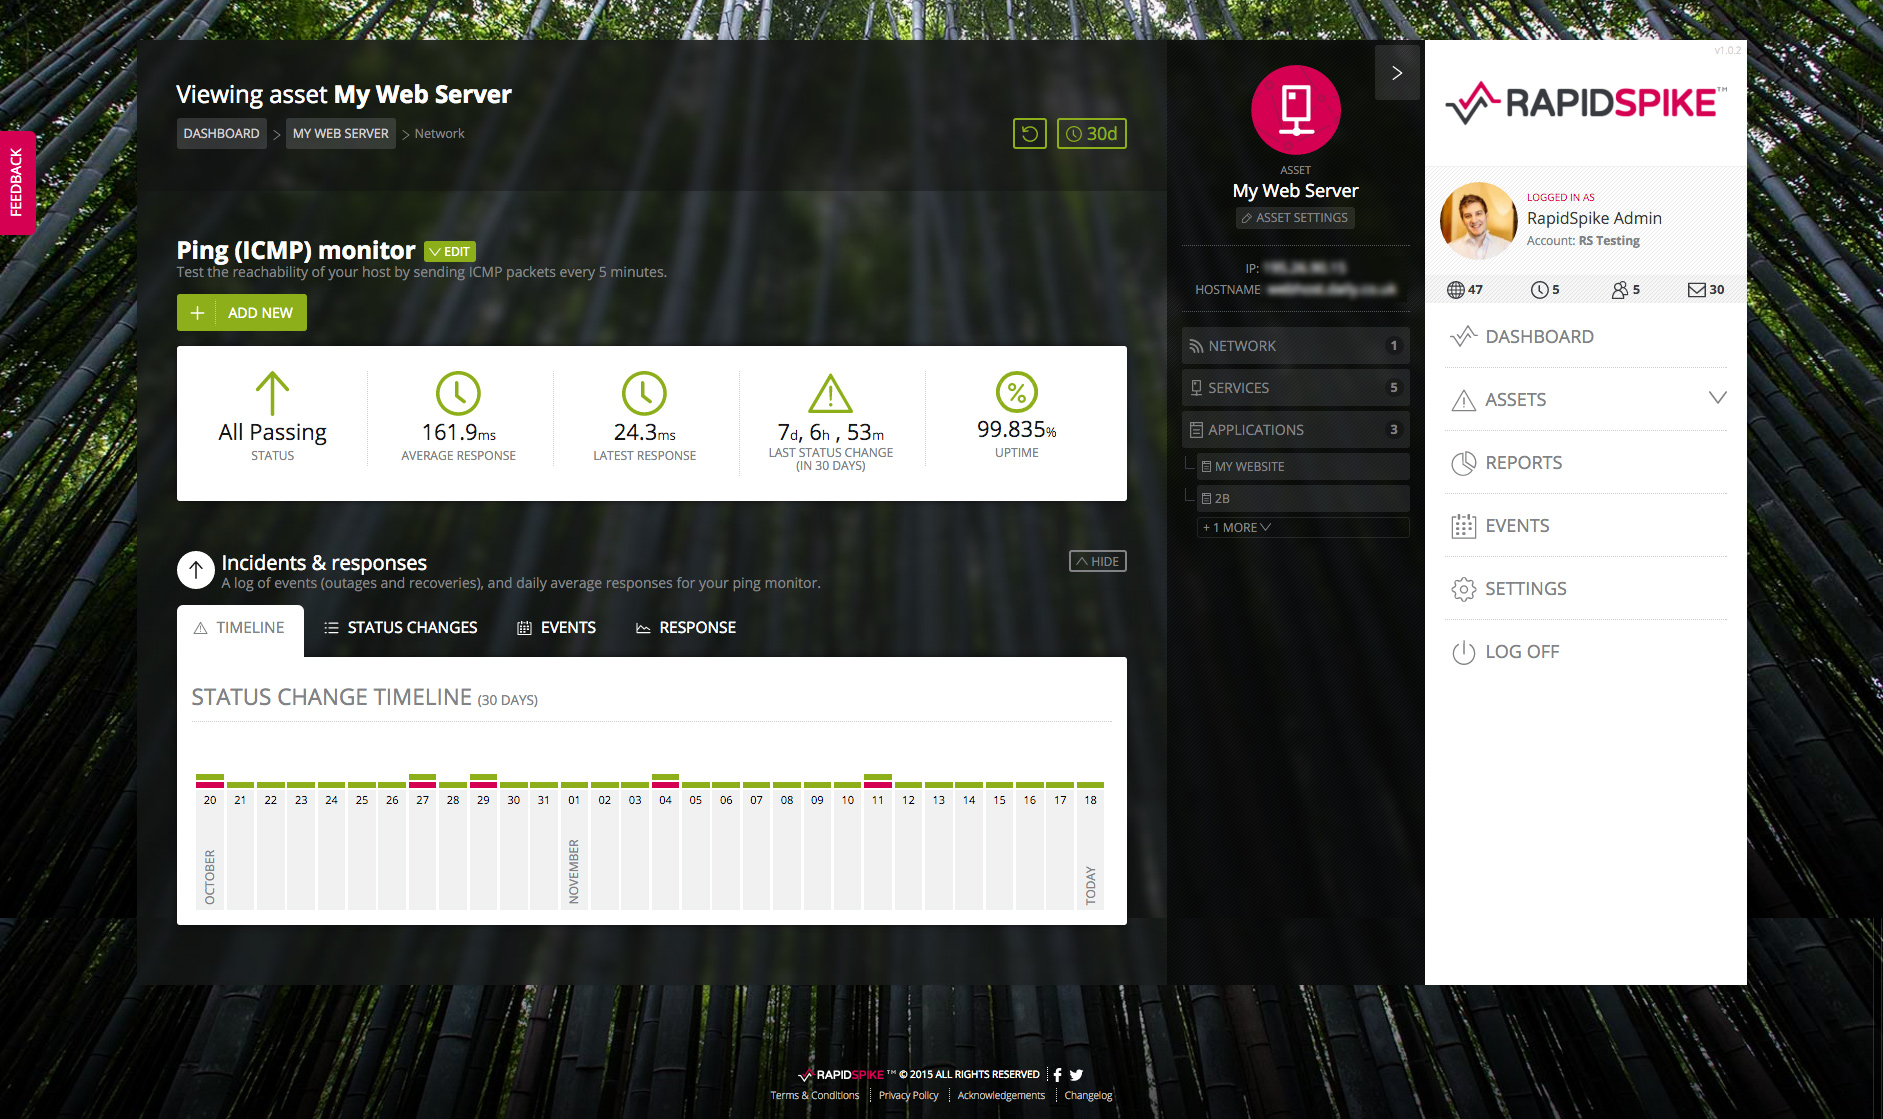
We re-emerged in June with an ‘alpha’ build of our app – and we’d invented a new way of looking at our tests.
We sorted each unique IP address into an ‘asset’ – a way of organising monitors that belong together. Each ‘asset’ – usually a single server – displayed the tests in a logical series of screens that allow you to truly monitor the health of your entire infrastructure. Perfect for small businesses with mixed-use servers, and ideal for larger businesses needing that birds-eye overview.
We quickly moved to a Beta Test of the new app and invited the public to take part.
The response was hugely positive, we garnered a ton of great feedback, feature requests (and the odd bug report.)
Gearing up for launch
We started to layer in more functionality – a full notifications system, detailed dashboards, reports, tiered user accounts. These are the day-to-day core components that make an app usable.
We had a way to help our customers see a complete overview of their digital empire.
But whilst we worked on these parts of the app we were discussing something much more exciting.
Our creation of the ‘asset’ view had brought up some really interesting points about the way businesses look after their online infrastructure. We had a way to help our customers – business owners, sys admins, tech directors, developers – comfortably see an overview of their digital empire.
- They could see issues occurring within the infrastructure, and solve them more quickly.
- They could feel confident that every relevant port is being checked, every page monitored for changes.
- Deployments would no longer need such rigorous human testing.
- We could arrange their data in a much more comprehensive way.
- Future tests could suggest new ways to assure their servers & websites.
With RapidSpike we’d give them a full assurance that their platform is stable (and point out areas where it’s not). All we’d need do is add to our tests in other areas – domains, SEO, performance, usability, load testing. We had our road map for the future.
Following the eCommerce Expo in London on September 30th, we launched RapidSpike.
We’re a couple of months on from our launch and releasing new updates every week.
Along with all the usual bug fixes and performance boosts we’re adding some really exciting and useful new features that will continue to make the platform a unique and truly valuable offering. We have our eye on the bigger picture and we’re excited about where we’ll end up.