Website speed and functionality are incredibly important. They directly affect the experience a user has and if they’ll make a purchase, contact the company or simply return again. Understanding Element Waterfalls can help identify issues such as slow load times and poor rendering which can quickly deter a user and impact their trust in your services.
RapidSpike Page Performance Monitors (PPMs) load your web pages in real browsers and record Element Waterfalls in order to help find issues.
What is an Element Waterfall?
Element Waterfalls show interactions made by websites as they load. The interactions can be for retrieving elements of the website’s structure such as HTML, CSS, JavaScript, and images. Or they may be requests to services that are installed for analytics purposes.
The interactions are recorded against a timeline that begins when a user enters a web address (URL) into their browser and ends when the page has completely rendered. Web pages can be made up of hundreds of elements so there is a lot of data being recorded and charted in the waterfall.
Interactions are made up of two parts: the ‘request’ (asking for something) and the ‘response’ (receiving something back). Both of these parts are accompanied by headers which contain more data (metadata) about the request and response.
How are Element Waterfalls generated?
Waterfalls are generated from HTTP Archive (HAR) files which are a web specification maintained by the World Wide Web Consortium (W3C).
“The HTTP Archive format, or HAR, is a JSON-formatted archive file format for logging of a web browser’s interaction with a site.”
HAR files gather data on a number of areas of the interaction:
- The request URL – this is the address that the request is being made to
- The request method – this is a capitalised verb that describes the intentions of the request (e.g. GET, POST, PUT, DELETE)
- The request and response headers – the additional data sent and received in the interaction
- The response HTTP code – this is a numeric code that gives an indication as to the outcome of the request
- Size of the interaction’s response – simply the size of the image, file or request’s response
- Detailed timings data – everything from DNS lookup time to how long the browser waited for a response (more on this later)
RapidSpike PPMs record additional data into the HAR files including the IP address we think the interaction’s requests were made to, the location of the IP address and what was sent in the request.
How do you read an Element Waterfall?
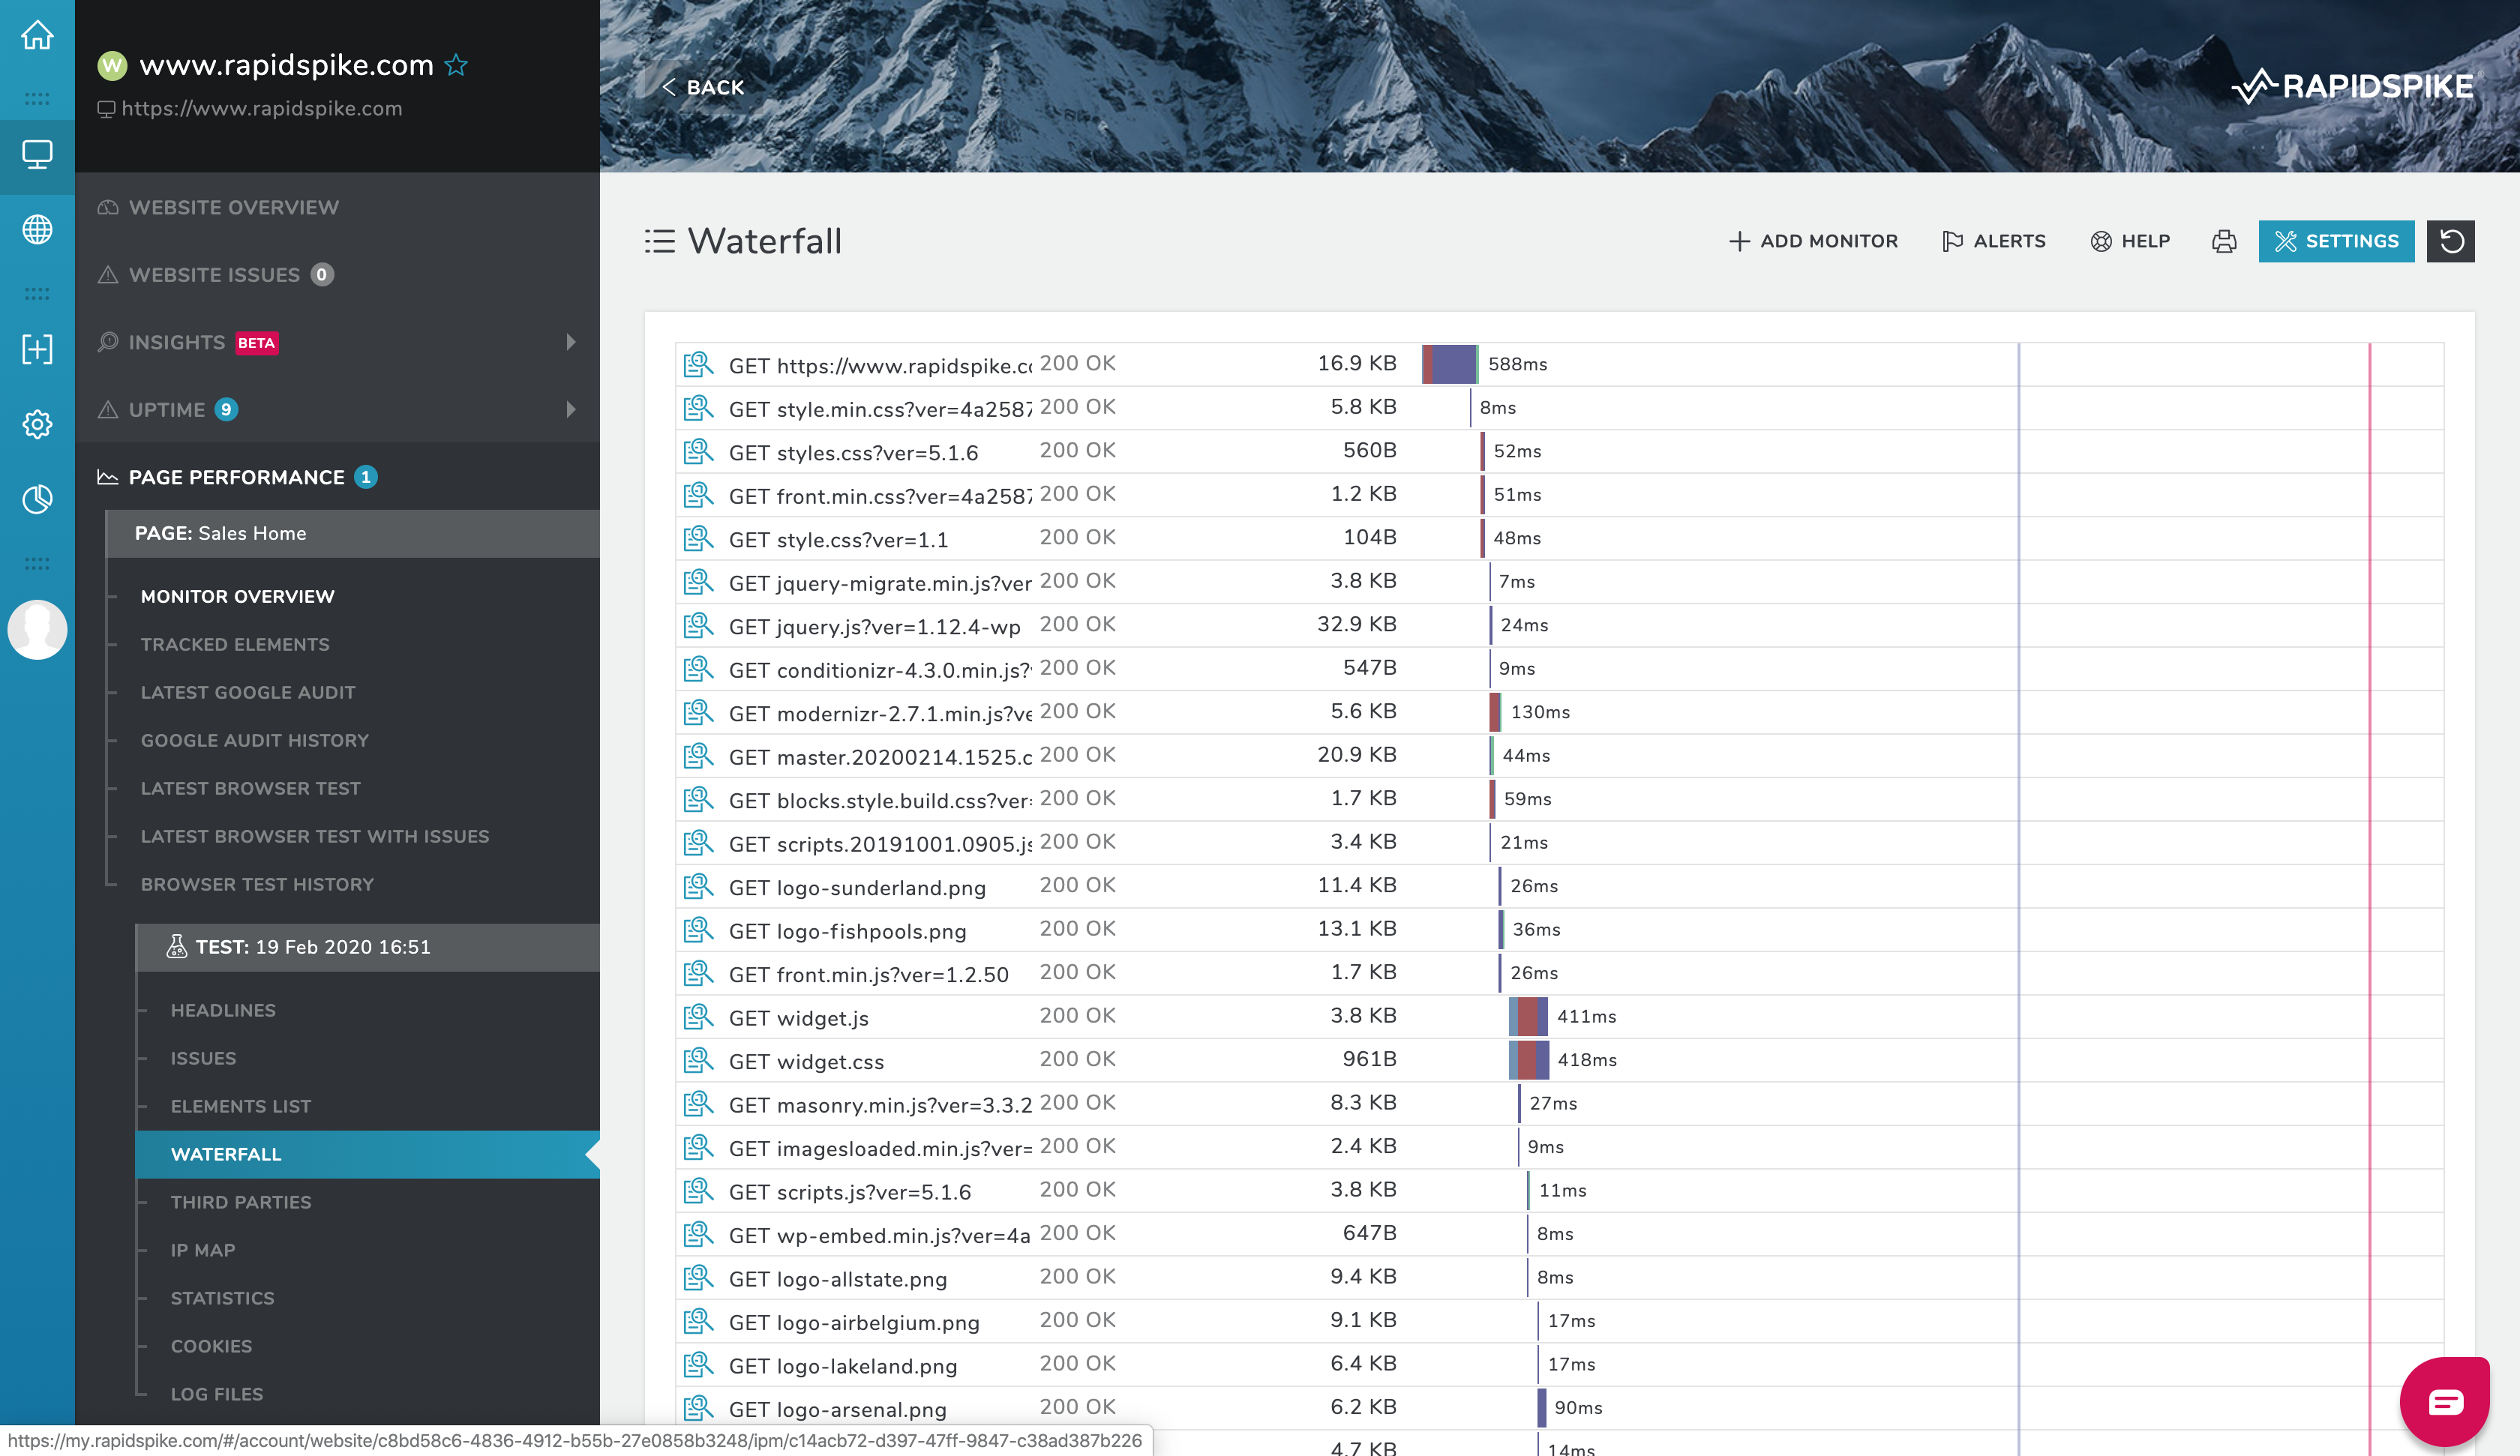
The Element Waterfalls in RapidSpike consist of 5 main columns:
- The request method
- The request URL
- The response HTTP code
- The response size
- The timeline

Here we see the first interaction made by a PPM running on www.rapidspike.com. This is the initial request from the browser to the main URL (2) and is made via a GET request (1). The response was a 200 OK (3), it was 16.9 kilobytes (4) and took 583 milliseconds to complete (5). The icon on the far left opens up the RapidSpike Element Explorer.
Hovering over the timing block in the timeline column (5) shows a detailed breakdown of what makes up that 583ms. The detailed timings here are rounded down to the nearest whole number.

Timeline Timings Breakdowns
The timeline is a graphical representation of how the page has loaded over time. It can be really useful for identifying bottlenecks where elements are preventing subsequent elements from loading. Each element interaction is broken down into 6 distinct timings:
DNS
This is the time it took to convert (resolve) the URL to the IP address of the server that hosts the element being requested. Imagine posting a letter: the street address is the URL, the destination itself is the server and the post service’s sorting office is the DNS server. Long times here can indicate a poor DNS service – we would recommend using CloudFlare.
Connect
This is how long it took to establish a connection with the server hosting the element once DNS has resolved. Slow times here could be due to poor server connectivity or even geographical distances.
Send
This is the time it took to send the request to the host server once the connection had been established. Requests made over POST and PUT will be higher because they usually have large ‘payloads’ included (imagine posting a large parcel).
Wait
The Wait time is how long the host server took to generate the response. If the requested element requires a lot of software processing or database queries then this time could become quite long. Therefore this metric is important for identifying if your back-end software requires optimisation.
Receive
This indicates how long it took to receive the response back from the host server. This is often relative to the size of the response – large response means long receive time. This time is an indicator that images need optimising or CSS and JavaScript files minifying. Also, Content Delivery Networks (CDNs) can provide great improvements here.

Blocked
Finally, this time is how long the interaction was blocked and had to be ‘queued’. This can occur for various reasons; the browser considering it lower priority than other elements, lack of connection availability at the host server or due to time spent negotiating routes through the internet.
Understanding how to read these metrics out of the Element Waterfall is a great skill to have if you’re in the business of web development. RapidSpike also records this data to be measurable over time – this is found in our Element Explorer.