Our Intelligent Page Monitor (IPM) is a great tool for several different reasons. It will detect element errors (e.g. 404s). It’s fantastic for AB testing. It captures a regular screenshot of your page. It runs from locations all around the world. And it’s a powerful performance monitor, giving you statistics for every element loaded on a page.
When Problems Occur
The most useful element stats are size, location and load speed, with load speed broken down into server request time, DNS, wait times, connection and receive time. When something is slow to load, these stats help you understand why. You can determine where in the path from server to website something is causing a delay. Determining root-cause analysis is a key part of debugging website problems, and the IPM is vital tool in your armoury.
- Slow Connection time? Your hosting server is running slow. Perhaps it’s time to add some new hardware?
- Laggy DNS or Wait times? Check where your files are hosted. Perhaps you should move your host closer to where your traffic is coming from.
- Long Receive times? How big is your file? If it’s an image it can be optimised or resized. Scripts and stylesheets can be minified.
- 404 Not Found errors are easily solved, yet sometimes are disastrous for your usability.
Introducing: IPM Comparison
This week we’ve released a new feature to help with debugging. An update to Intelligent Page Monitors that enables you to view two completed IPM tests side by side.
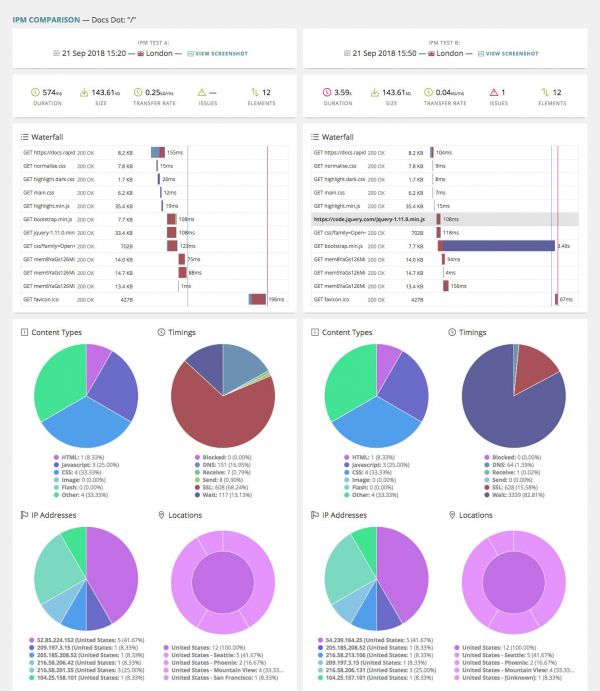
The new compare tool gives you a simplified view of element data for the test, as well as screenshots and headline stats. You should be able to quickly and easily pinpoint any performance issues.
The compare view also has a full version of the HAR (HTTP Archive) files for both tests. HAR files will detail everything there is to know about every element loaded during the test. Just click on a row in the table to see the full data:

Getting Set Up
Loading the compare tool couldn’t be easier. Open your IPM and go to the Test History screen. You should see a new checkbox on each row, under the column heading “Compare”. Check the box next to any two tests (on any page, or across multiple pages).
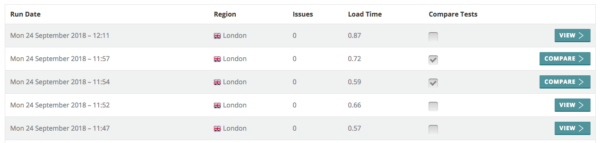
When you tick two compare boxes, the “view” button will change to read “compare”. Click it to view the results comparison.
We think you’ll find the IPM Comparison a really valuable root-cause analysis tool that will make solving web page performance issues quick and straightforward.