
Core Web Vitals are a new set of performance metrics that are part of Google’s ranking algorithm. In this blog, we explain how to measure Core Web Vitals scores.
There are many ways website owners can find out their Core Web Vitals scores. This includes: PageSpeed Insights, Search Console, Lighthouse, Chrome DevTools, Chrome UX Report, and the Web Vitals Extension.
Metrics will differ across desktop and mobile, therefore it is vital website owners measure their Core Web Vitals on both platforms. This will help gain a true understanding of how customers experience their website. For each of the Core Web Vitals, it’s important to attain the ‘Good’ target at the 75th percentile of page loads across mobile and desktop.
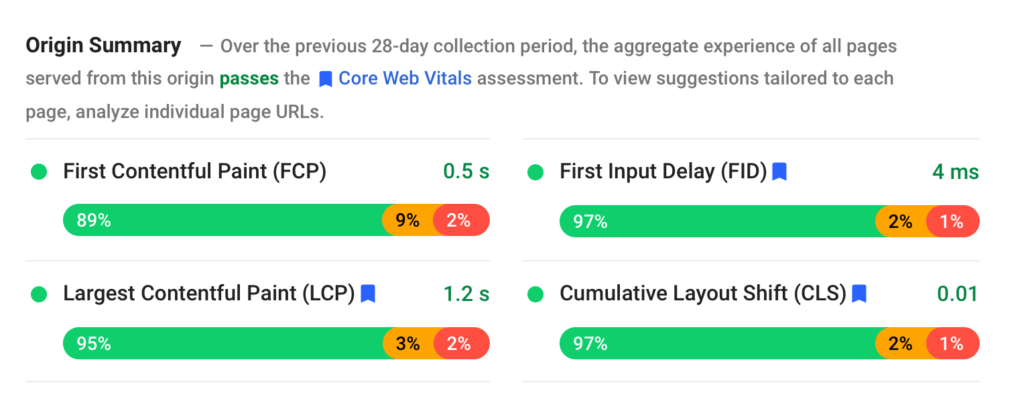
To understand how your website is performing, PageSpeed Insights is a great first step in the process. Not only does it highlight Core Web Vitals, but it also has opportunities to help your page load faster, and diagnostics that include more information about the performance of the website. It should be noted that these do not directly affect the overall performance score.
However, there are problems using single test PageSpeed Insights and Lighthouse as they do not form a single point of truth. Different machines, locations and times provide different results and historic results are 28 days behind. You need something that consistently and continuously monitors your Core Web Vitals 24/7 and not only this you need to be able to debug historical and intermittent issues.
Measure Core Web Vitals with RapidSpike
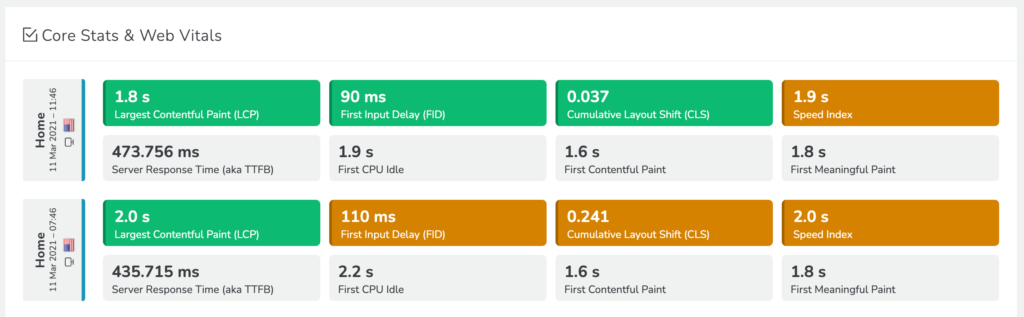
For everything you need to measure and monitor Core Web Vitals, try the RapidSpike Performance dashboard. RapidSpike uses the same colour-coded thresholds as Google, making it easy for you to know which scoring bracket your website falls under. Using RapidSpike performance tools including the full waterfall, elements and 3rd parties viewer, Google Lighthouse integration and Insights helps you to pinpoint performance issues, and track your Core Web Vitals metrics over time.
The Performance dashboard gives an overview of your website performance by region and device. The Trend Graph helps to visualise how your improvements have affected your website performance over time, and can be viewed by the three Core Web Vitals metrics as well as Speed Index. Google’s Chrome UX Report is updated every 28 days, RapidSpike Core Web Vitals can be updated up to every 5 minutes, helping you effectively monitor your scores.
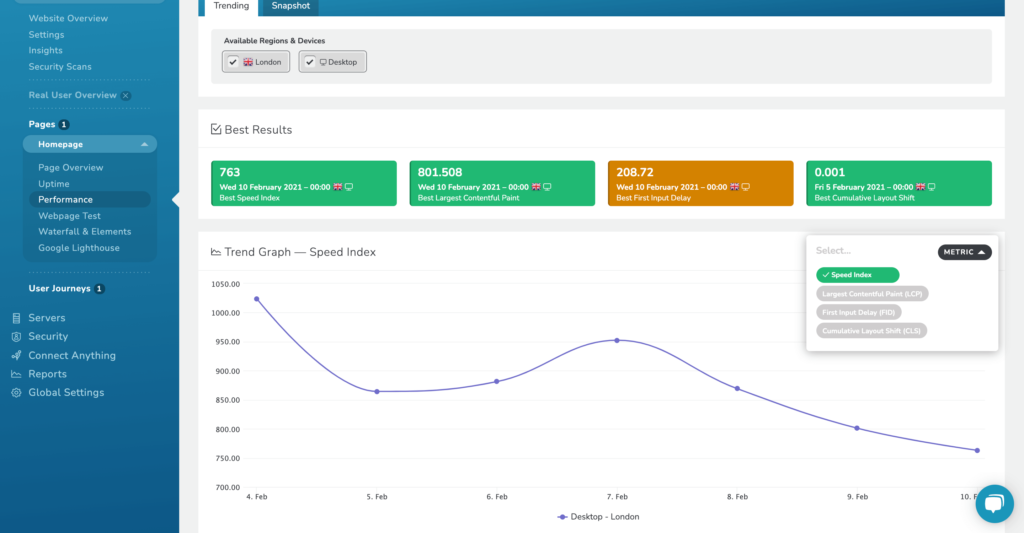
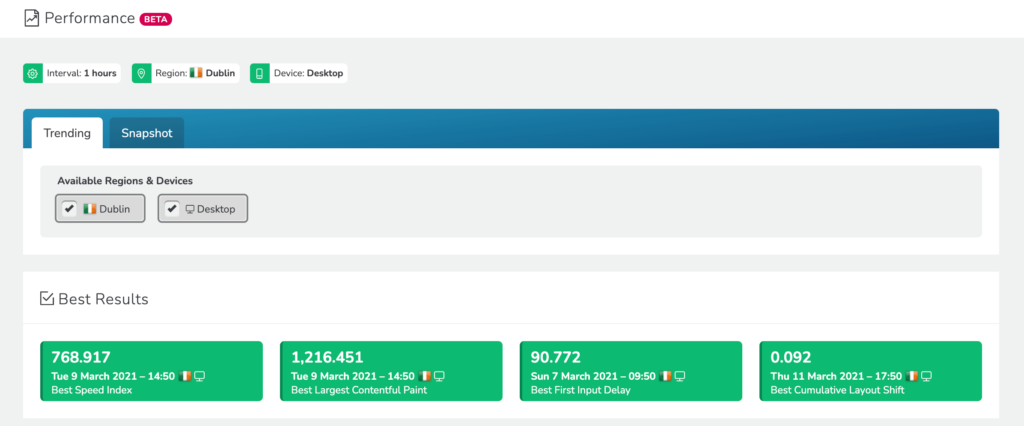
The Best Results section shows when you had your most successful Core Web Vitals results, identifying highlights.
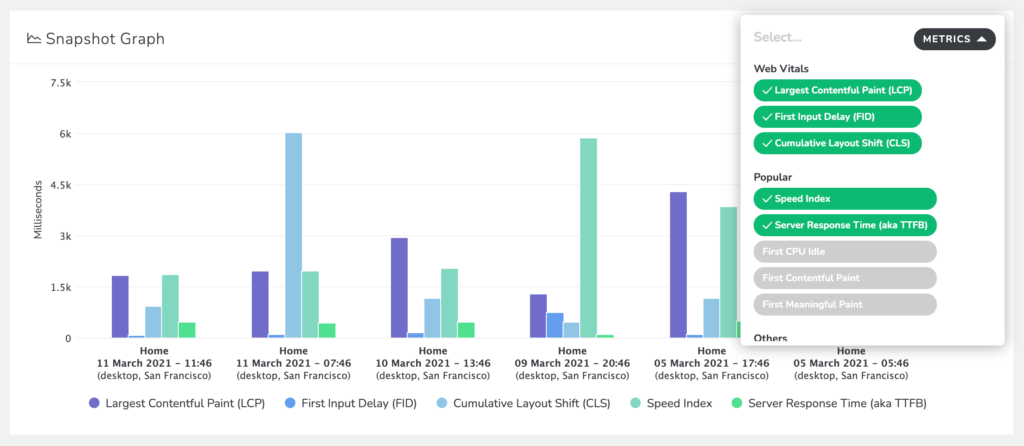
A really useful tool in the Performance dashboard is the Snapshot tab – here you can see all tests carried out and view the Core Web Vitals results for each of those tests. Compare up to six tests at a time to track improvements, and debug issues.
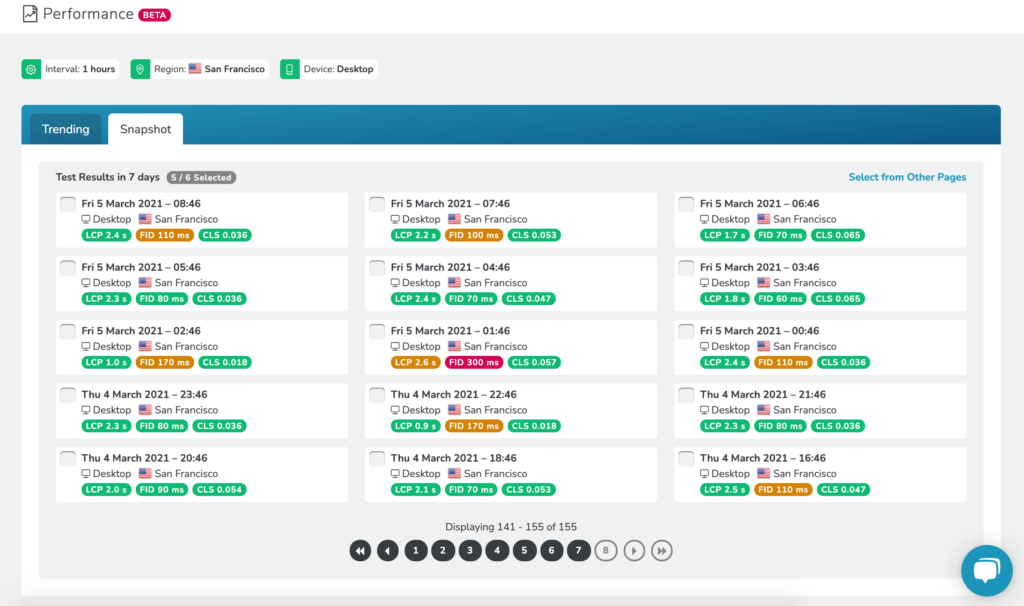
Compare tests by desktop, mobile, and region and view the performance metrics which matter to you most.
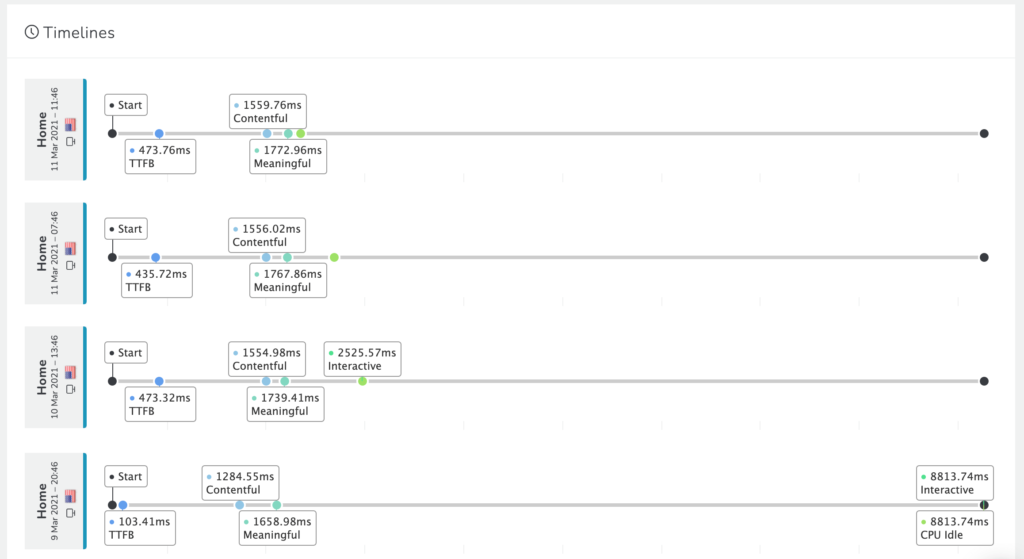
View a timeline of your tests to see how your customers experience your website with key points of user experience plotted including Time to First Byte (TTFB), Contentful Paint, Meaningful Paint, Interactive and CPU Idle.
Compare Core Web Vitals and additional performance metrics including Speed Index.
Google has made it clear that website owners need to consistently measure Core Web Vitals scores. Core Web Vitals make up part of the ranking algorithm, the time to start measuring and improving your Core Web Vitals scores is now.