If you’ve been keeping a close eye on the RapidSpike platform, you’ll know that in the past few months, we’ve released a bunch of really useful website monitoring features and upgrades that make using the platform even more intuitive. Learn about the new Setup Wizard and our other new features below:
Setup Wizard
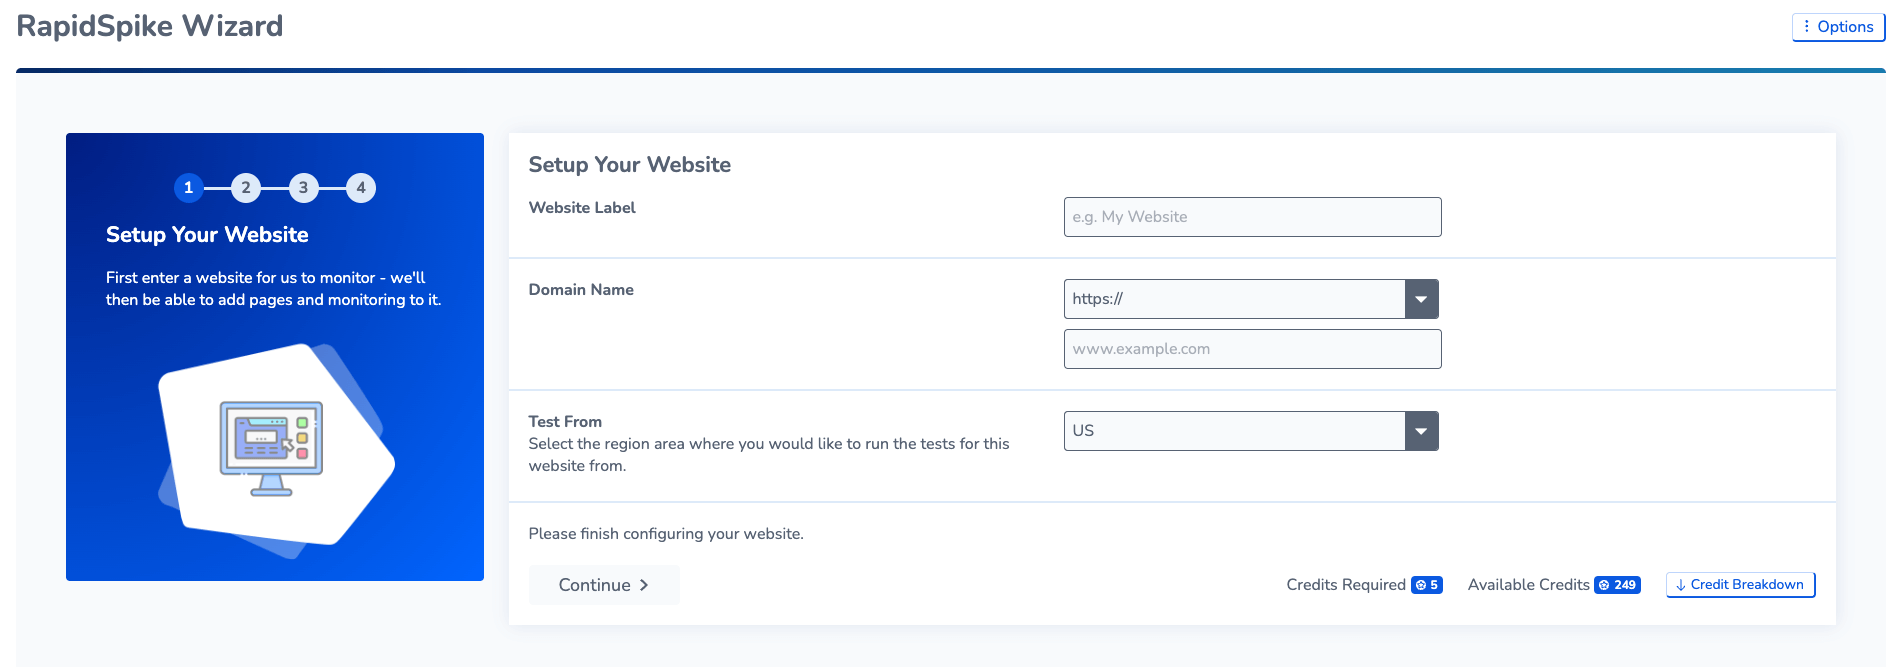
Our new Setup Wizard makes setting up monitoring for a website, a breeze! Once you click on the ‘create’ menu button in the app menu you’ll now access our Setup Wizard that allows you to set up website monitoring quickly and in the best way possible. Instead of doing the setup yourself, we’ll do it for you. For example, on manual website setup, we ask which region you want to test in, in the new wizard we’ll set all the monitors to test from the best region we have available for your selection.
The time-saving doesn’t stop there, we also scan your website for the navigation element that allows us to suggest the first 5 pages you should add to this website, whilst also giving you the ability to add and remove pages in the setup wizard. Doing this means that you don’t have to go into your website in RapidSpike and add each page individually.
Finally, we give you the option of 3 different levels of alerting, ranging from no alerting at all, to a full alerting suite that notifies you of all failures on all monitors that we create for you. The Setup Wizard gives you a fast and efficient creation process for websites, pages, monitors and alerts all in one place meaning you can spend more time exploring the dashboards and features of RapidSpike that we offer.
Keyboard Shortcuts
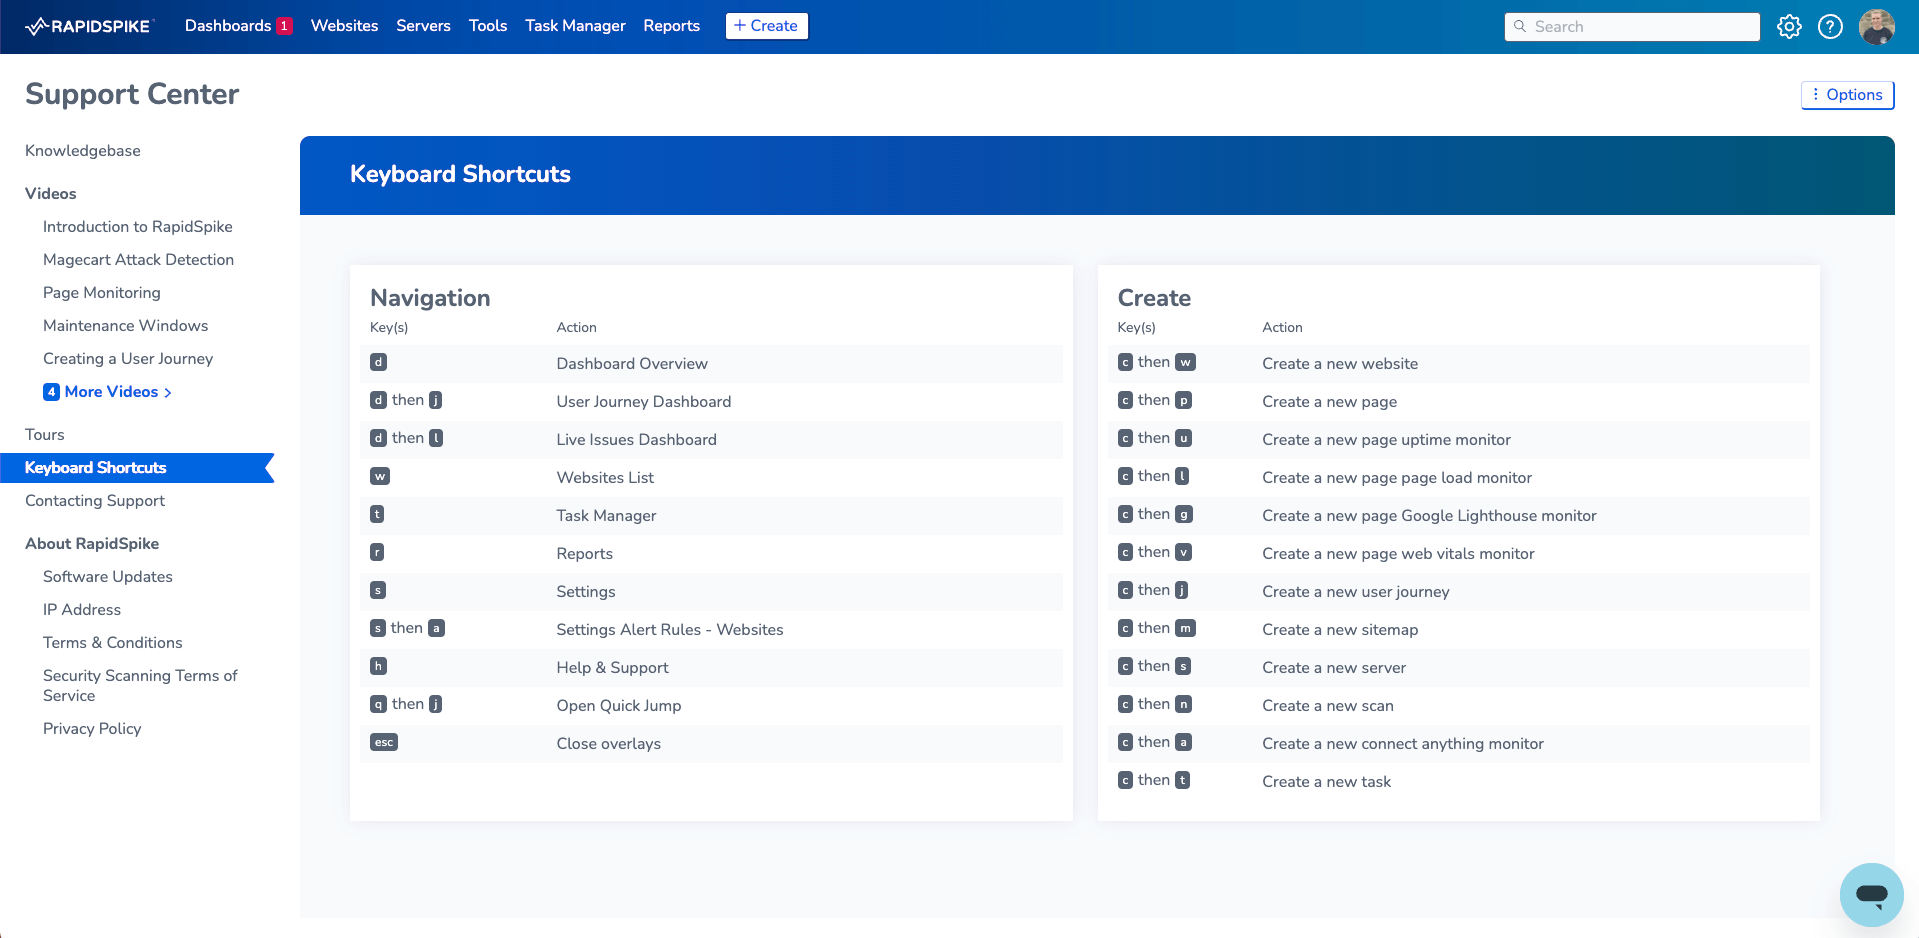
Who doesn’t love a shortcut? RapidSpike’s new Keyboard Shortcuts help you to navigate around the app quicker, providing access to the main dashboards and sections of the app. Keyboard shortcuts can be enabled in the app preferences section of the settings and you can find all the available shortcuts in the support center.
Quick Jump
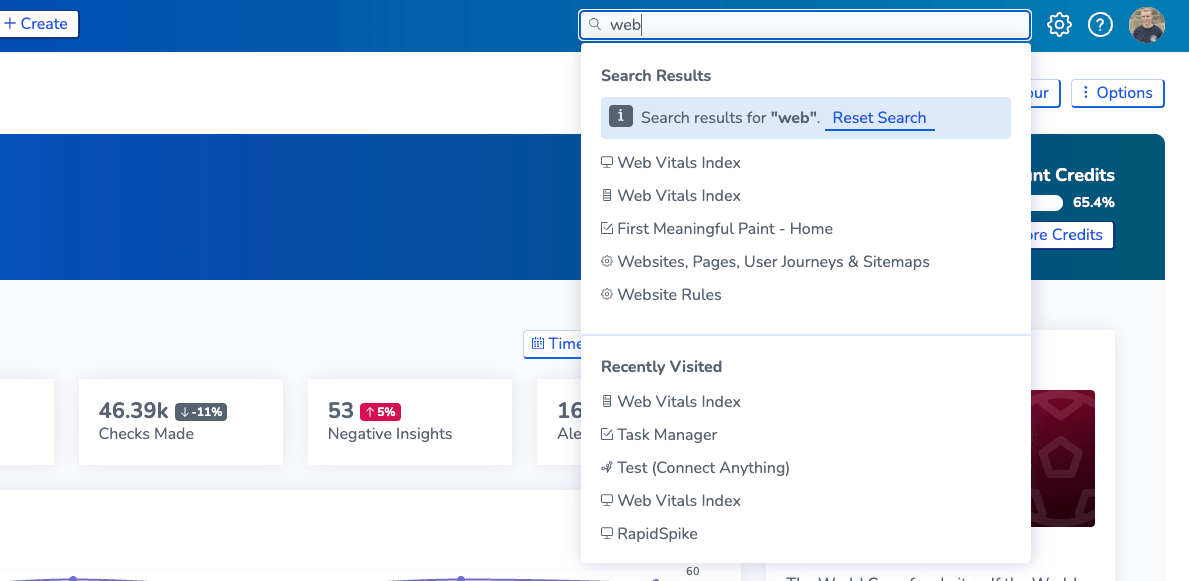
Quick Jump offers you a global search of RapidSpike. Quickly find websites and all the associated monitors, alongside dashboards, settings pages and much more. Quick jump also houses the recently visited list, containing the 5 most recently visited pages. Quick Jump can be found in the main app header, there is also a mobile option available, which when used, will take you to a stand-alone search page.
Website Switcher
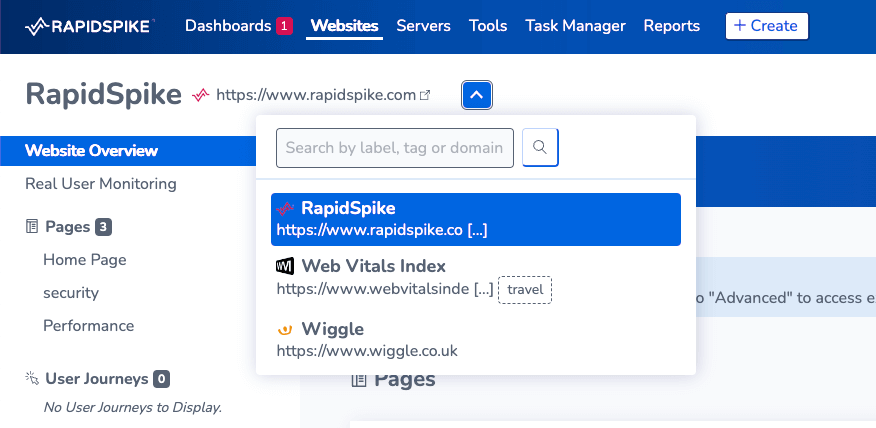
Website Switcher gives you the ability to easily switch between websites without having to go back to the website list. It is available on the website overview of all websites.
Pinned Dashboards
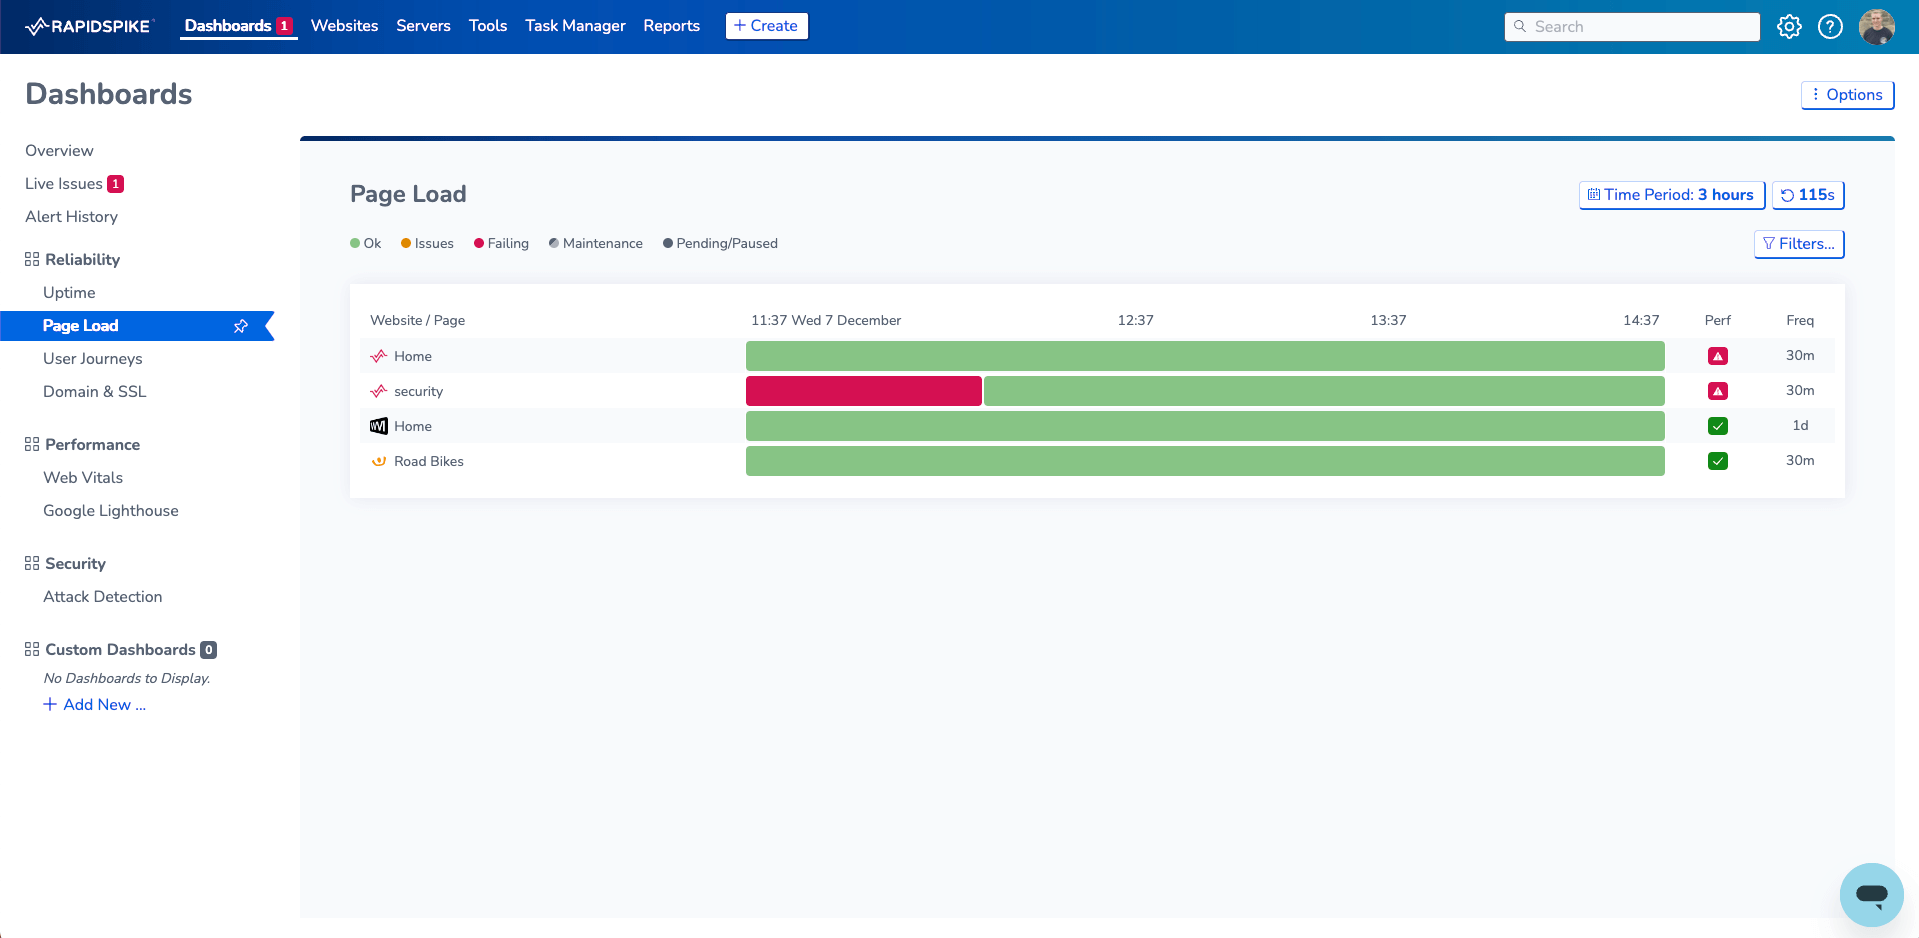
Favourite dashboard? This new feature will put the chosen dashboard as the one that shows when you first log into RapidSpike, instead of the generic overview. You can set up your Pinned Dashboard in the app preferences.
Journey Event Notifications
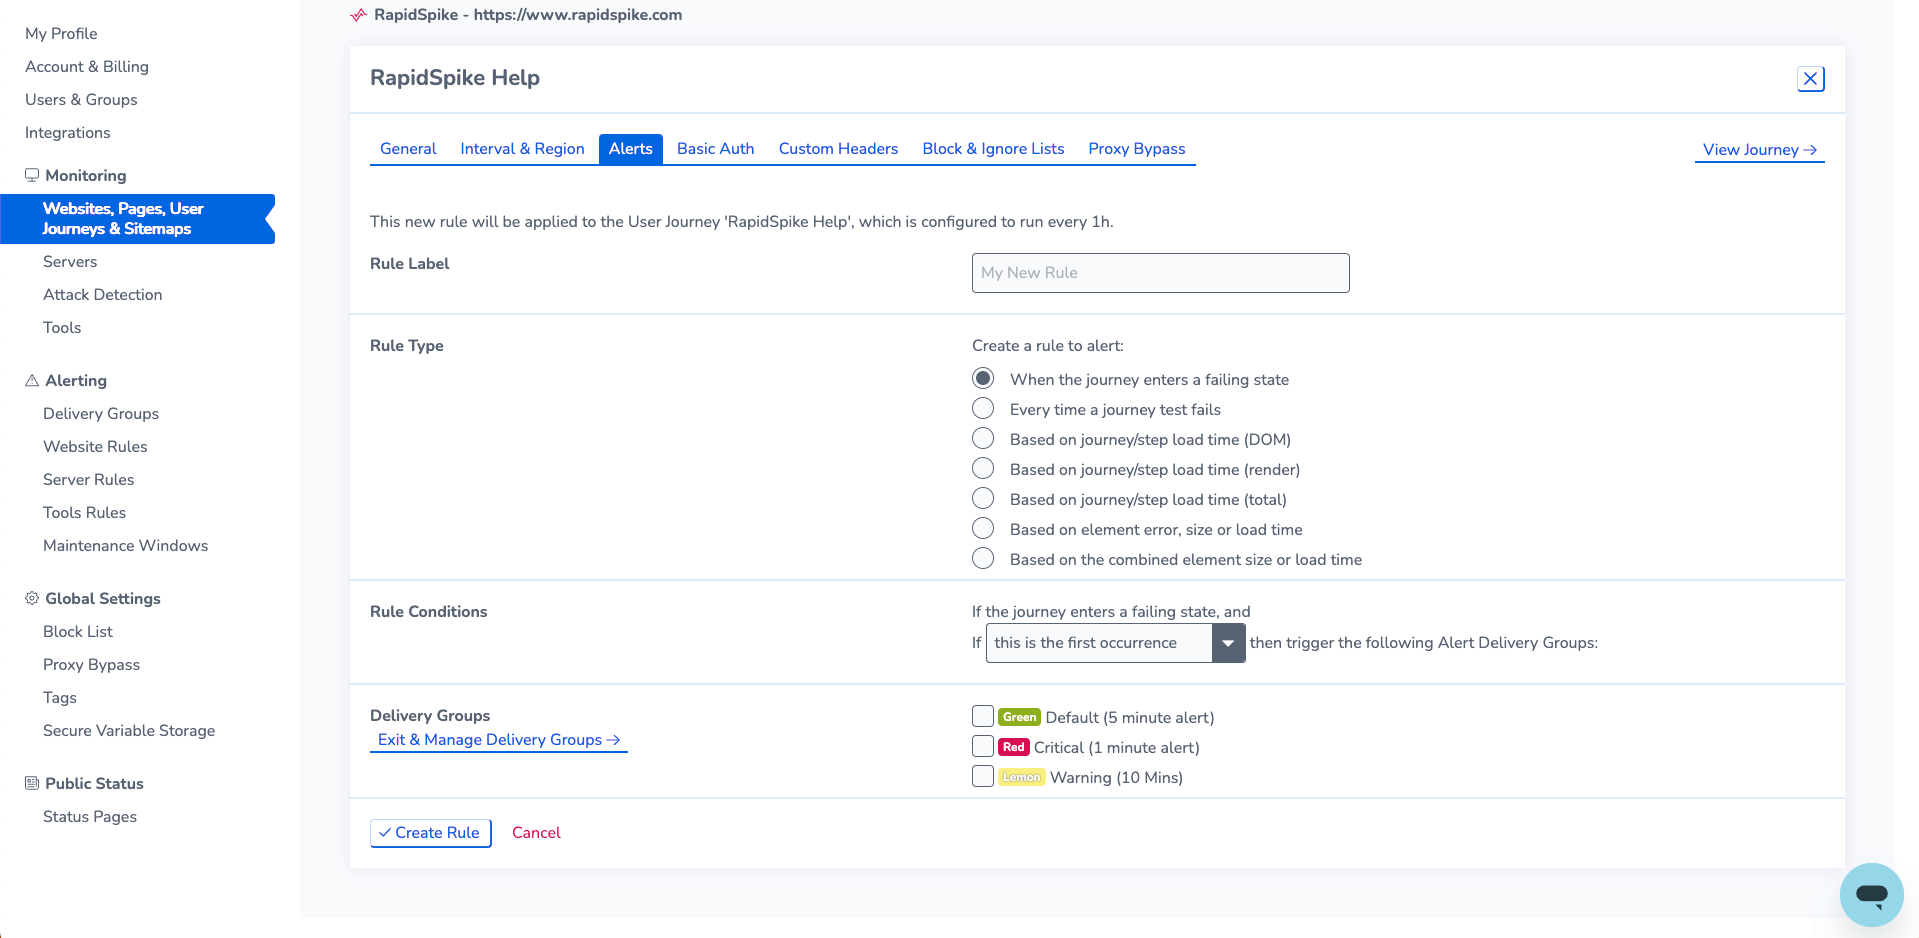
Our Synthetic User Journeys just got an alerts upgrade! Journey Event Notifications only alert if the user journey has failed and then again when it passes, rather than alerting for every failure in a row. This reduces the number of alerts received for continuously failing journeys (and saves your inbox from filling up!). These notifications can be found in the alert rule settings for user journeys.
Print Button
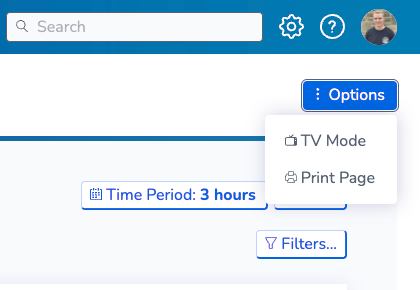
The ‘Print Page’ button allows you to do just that. It can be found in the options button, on the top right-hand side of the dashboard. This is a great feature for sharing dashboards, looking into findings and reports. This is one of our customer requested website monitoring features, so we know just how useful this can be across teams.
Monitor Details
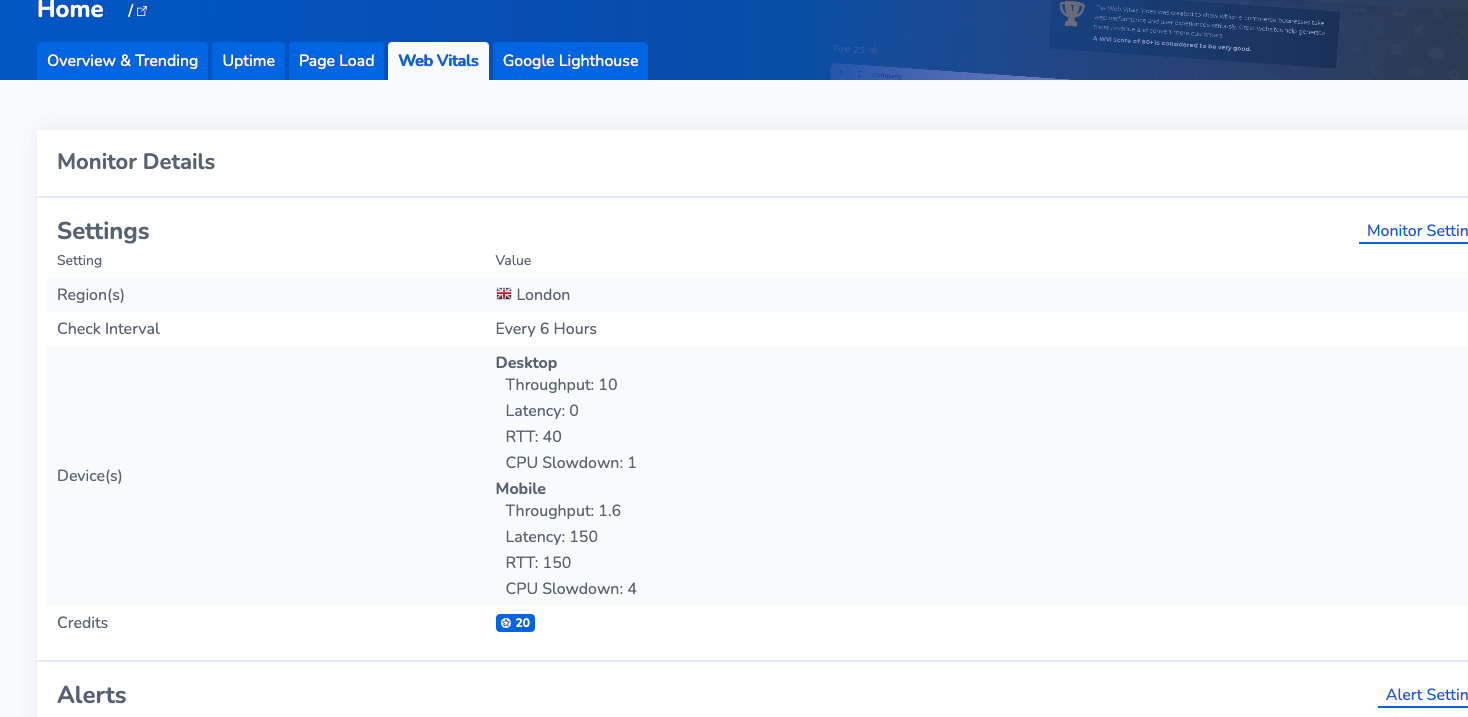
This allows you to view the settings for a monitor without having to go into the settings and move away from the monitor test results you are viewing. It can be found via the ‘Monitor Details’ button on each of the website monitors including Uptime, Page Load, Web Vitals, Google Lighthouse, User Journeys & Sitemaps.
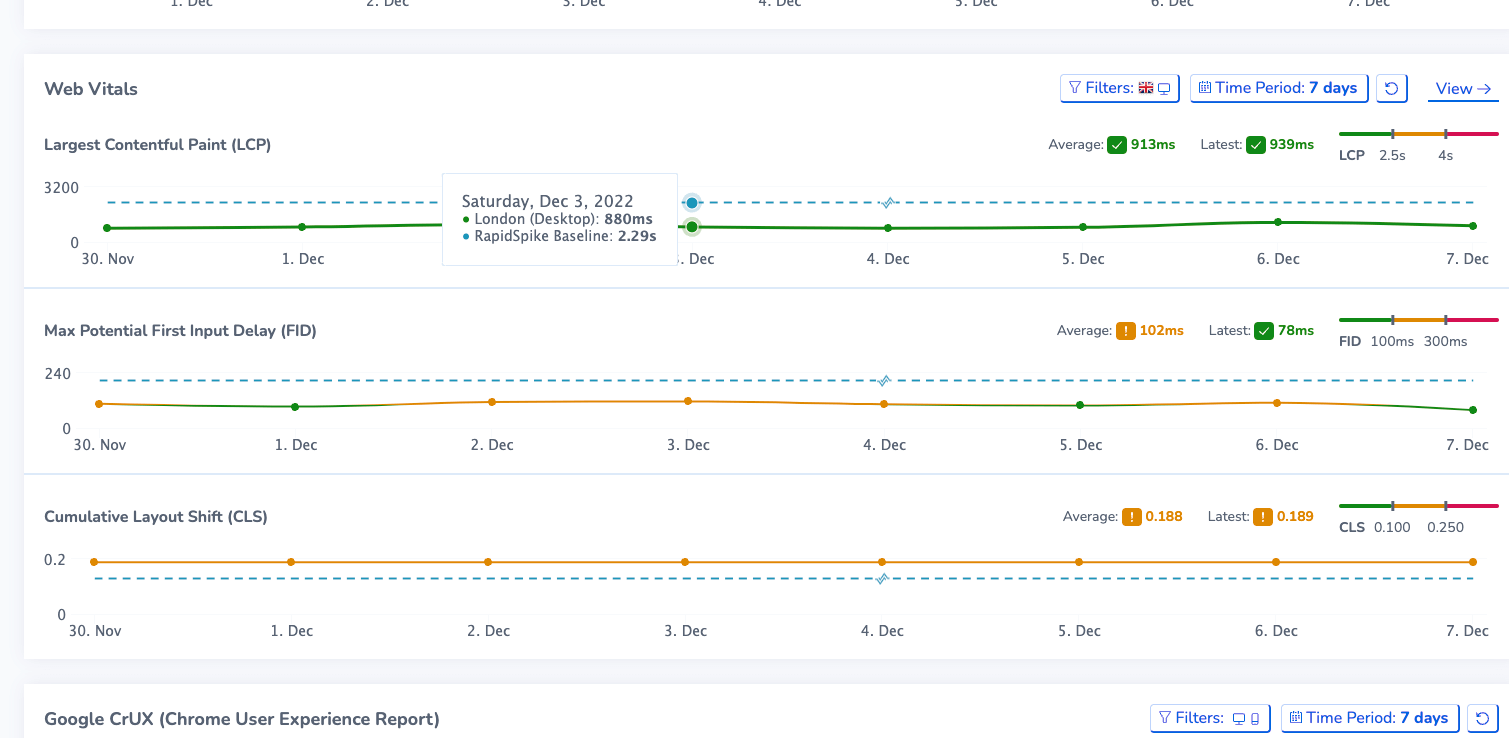
RapidSpike Baselines & Google Analytics Data on POD
Not sure how you compare? RapidSpike Baselines allows you to compare your page overview data, including web vitals, against the ‘RapidSpike Baseline’ which is an average of all stats across accounts in RapidSpike. This is a great indicator, so you can get a feel for how you compare against all RapidSpike users. In addition, if you have set up your Google Analytics integration, you’ll be able to see page views and bounce rates from your linked GA account.
This feature can be toggled on and off via the ‘Benchmarks’ button on a page overview dashboard. You will then see RapidSpike Baselines and Google Analytics data added to all of the graphs on the Page Overview Dashboard.
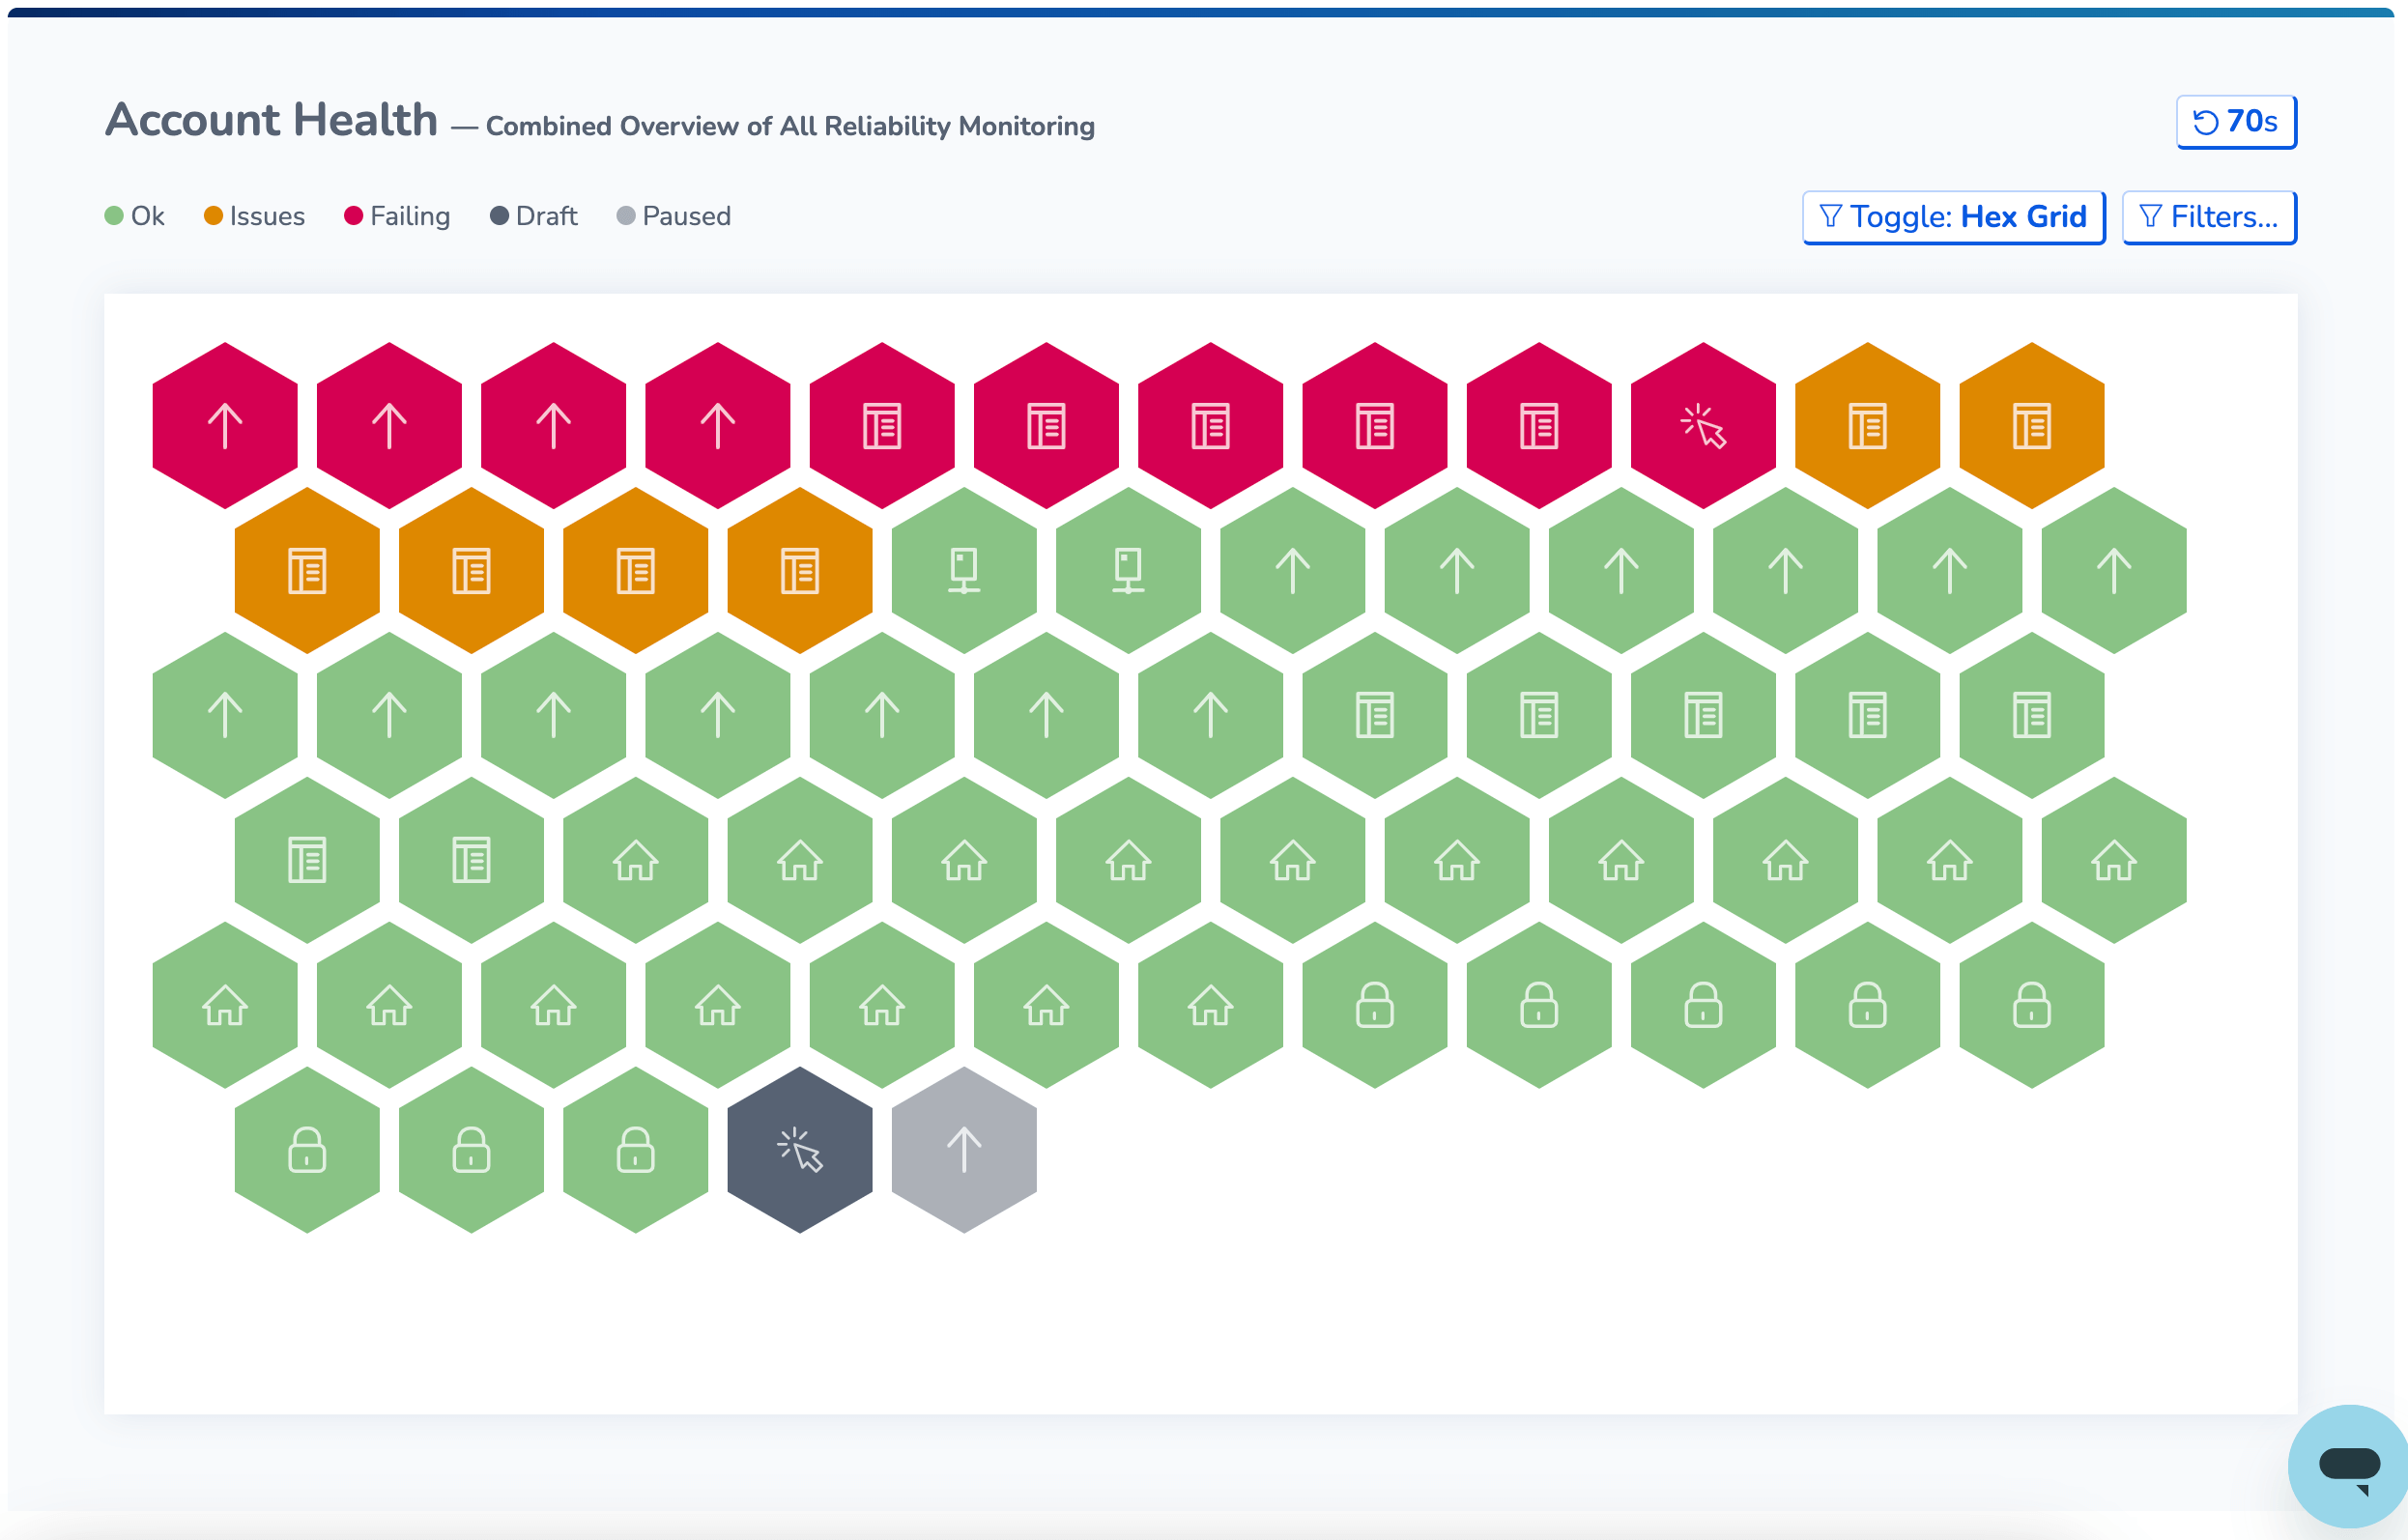
Account Health
Finally, our new Account Health feature shows a live view of your entire account’s core reliability monitors (Server and Web Page Uptime, User Journeys, Page load, SSL Expiry and Domain Expiry). This is a great dashboard to have up on a wall-mounted TV for an immediate overview of your account. It can be found in Account Health under “Reliability”.
Our developers have been working round the clock to deliver these new website monitoring features, so we hope you love them! If you would like any further assistance with any of the features mentioned above, please email our Support Team or message us on Live Chat today.
