This week has been an exciting one: we’ve launched our synthetic user journey monitoring solution!
In the web community, it’s been established that uptime monitoring is a useful and worthwhile tool. Its good to know your server’s network card is reachable. It’s better to know that your server is listening on port 443. It’s even better to be able to ensure your server is responding to HTTP requests with the desired HTTP response. And it’s pretty useful to be alerted before your domain name and SSL certificates expire.
However, here at RapidSpike we believe that to be fully assured your website is operating as it should be, uptime monitoring is not the only tool that companies should be harnessing.
How is your website performing right now?
Synthetic User Journey monitoring is a piece in the monitoring puzzle thats goes beyond the technical side of running an online business. How do you know if your website is actually navigable right now? How about if users are able to view – and more importantly purchase – your products?
Actual business critical processes are often ignored when website monitoring is put in place, and this is an area that we want to make simpler to assure.
As our newest service, we believe that this feature enables us to provide a total, managed monitoring solution for our customers. You tell us what processes are important to you on your website and we will write the test journeys. We emulate real users using real browsers from multiple global locations. Journeys could range from simply browsing around your website, to checking contact forms and sign-in processes are operational.
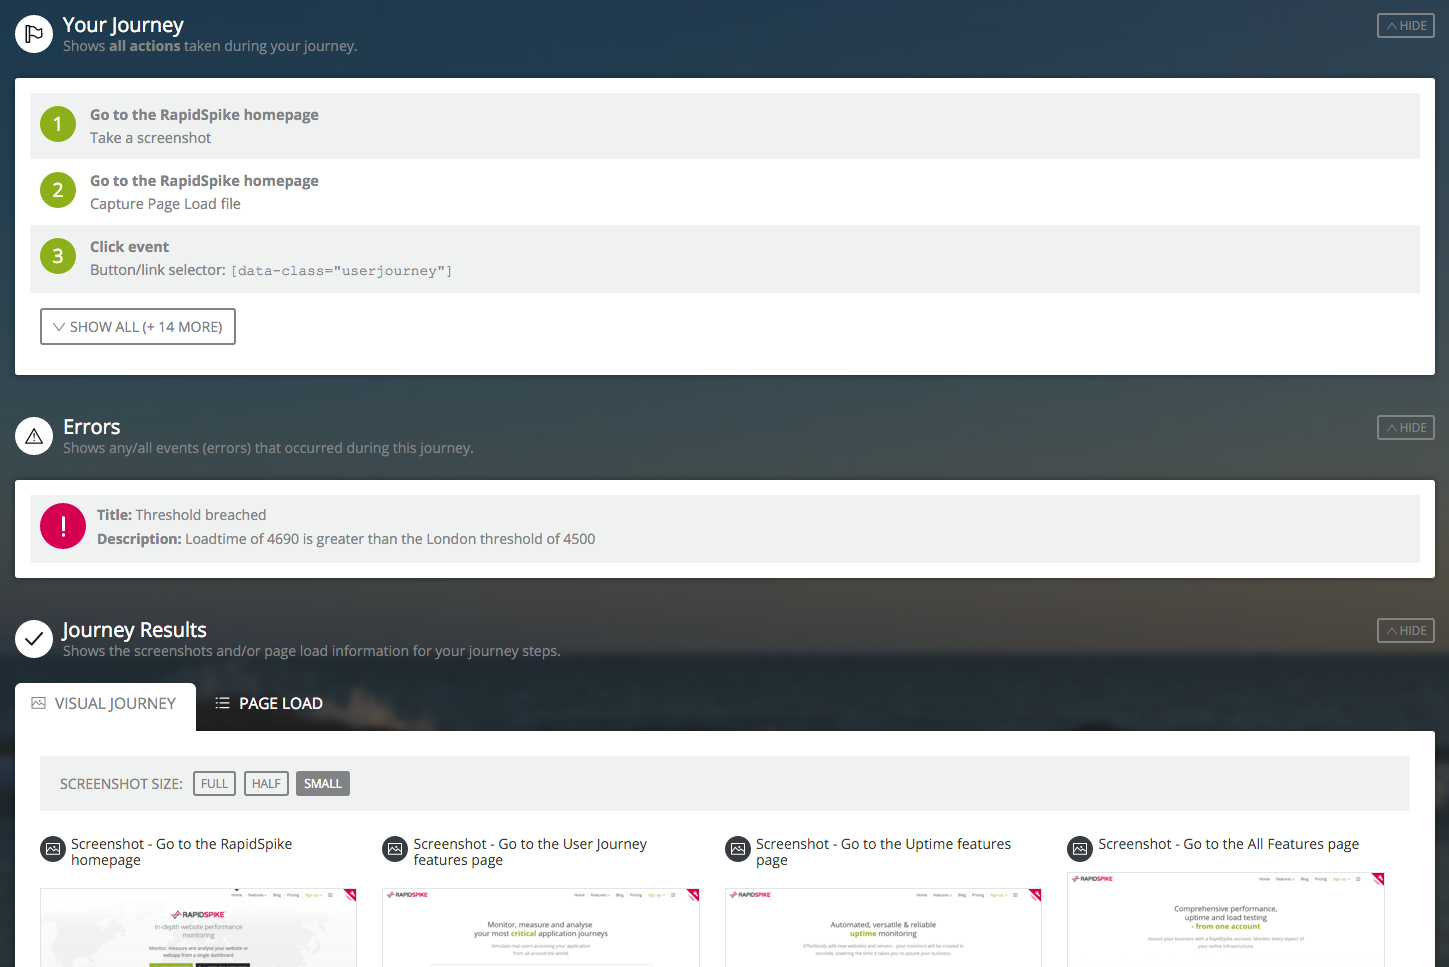
What results can we show?
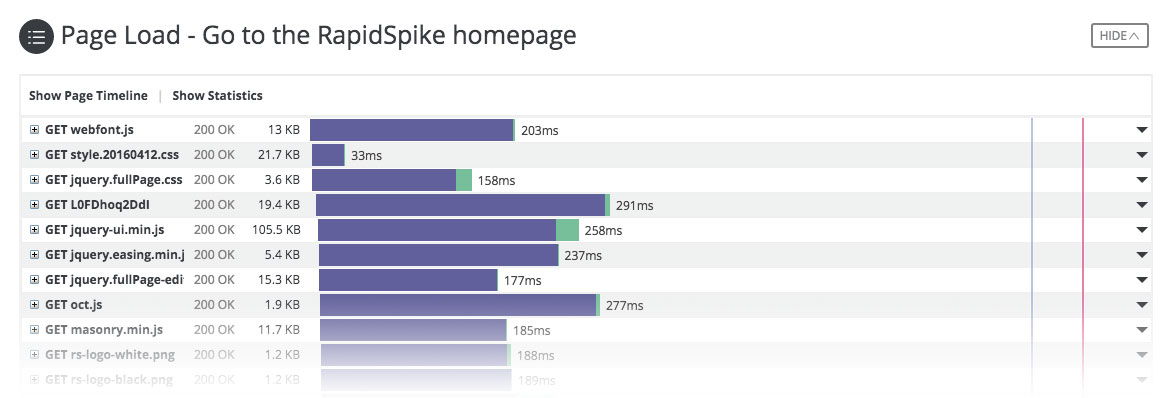
Our solution can screenshot all pages visited and actions completed in the test. But more importantly, it can also provide a detailed breakdown of how the visited pages are constructed.
By recording all elements of your web pages, we are able to expand our monitoring from just checking your web server is doing what it should be, to actually checking essential page elements. Many websites depend heavily on third-party assets such as images, Javascript libraries and advertising streams – we can now alert you if any of these specific elements fail to load.
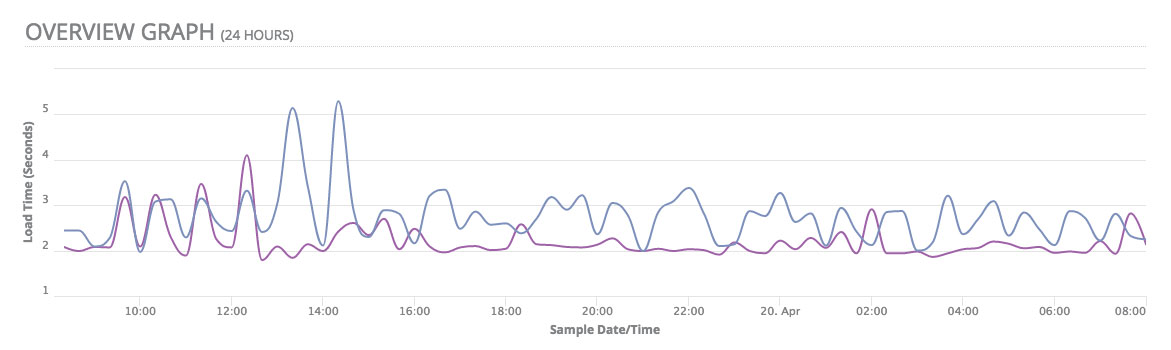
It also gives us great scope for combining this data with our other monitoring data. For example, if you see a slow down in your user journey speed, maybe it came at the same time as a surge in the number of site visitors recorded by Google Analytics. Watch this space to see how we evolve our monitors further.