When it comes to website errors and issues, seeing is believing. Like most developers, I’ve been guilty of using the line “it works on my machine” when confronted with an annoying bug that only shows up under some obscure conditions. But just because one person doesn’t see it, doesn’t mean tens or hundreds of customers aren’t experiencing it.
Our fully managed Selenium automation tests have always automatically captured a screenshot when a test fails. These are hard to dispute, but sometimes we need to look a little deeper to help discover what’s actually going on. Consider an example where a form stops working on a website. Visually the form could be visible on the screen and show up in the captured screenshot. But what if the code behind the form has stopped working? What if something has caused the code that builds and controls the form to change, which in turn stops the functionality from working? In this case, capturing the Page Source (the raw HTML, just like when you right-click on a webpage and select View Page Source) would be very useful. So we’ve added it in.
Introducing the Page Source Action
As well as automatically capturing the page source when a test fails, you can also manually capture the source code at any point in your tests. Simply add the action when building the test.
In the unfortunate event of a test failing, the page source will hopefully give you a little more to go on.

From the example described above, we can now clearly see in the page source that a bug has caused the ID in the form to be set incorrectly ?.

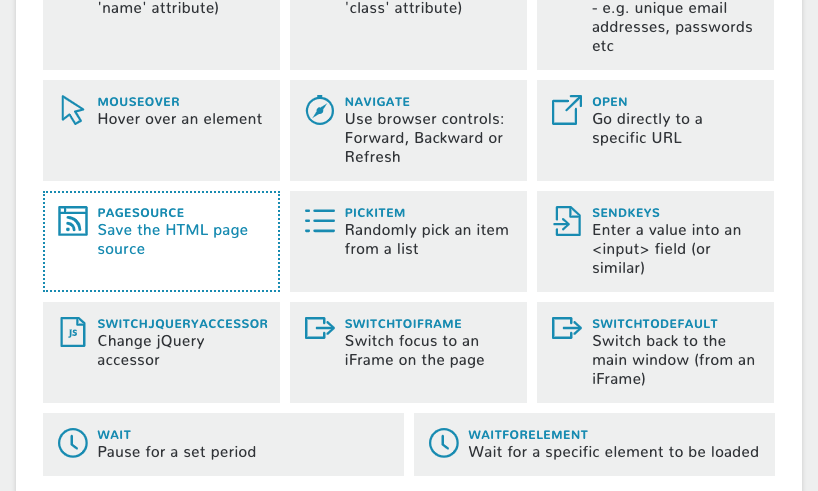
Page Source is just one of over 20 actions you can perform when testing your website. Request a trial and build your first test today!