OK, so before I go any further, I have to admit up-front that this post is in part helping to promote a new report we have recently implemented. Clearly, I accept that a new report is not that interesting or groundbreaking however I felt the the story behind it was read worthy.
So to put this article into some context, I have always had an issue with the reports many IT systems produce. I often look at the data and ask myself, “so what?” In other words, what is this really telling me?
For example, simply informing someone that their page load speed is 500ms is pretty useless. What does 500ms mean? Is it good or bad? should I be pleased or worried? In my opinion, many systems produce one dimensional reports and it has always kind of bugged me. I always like to see data measured over time or against a benchmark because it becomes more meaningful as it illustrates a trend or a way to measure the information.
Avoiding Data for Data’s Sake
As a company owner myself, I want to know whether we are improving or not? Data for data’s sake doesn’t tell me anything and I am always looking for ways to deliver information that is practical and useful to our clients. In fact, this is a mission of mine. I want to provide relevant information that is genuinely useful and easy to produce. So when a client personally requested a new report that would allow him to benchmark his performance against an industry benchmark I seized at the opportunity.
My client – who shall remain anonymous but let’s call him Dave – felt that industry comparative data would be a great way to measure his website’s performance and would be a great visual management tool for the company executives. I naturally agreed, the only challenge was deciding on a way to help him present the data in a report format that the Board could easily understand.
Luckily, I had overcome this issue before, so the answer was an easy one. A few years ago, in a previous role, one of my customers – an IT Director for a large enterprise – was openly frustrated with the system reports we were generating.
As he put it,
These technical reports are useless. They may be great for the technicians but they are meaningless to me, and of no use to the people who sign the cheques.
His words were actually much stronger than that but I remember the day he said it. For the first time in my career, I really got a true insight into an executive’s reporting needs. Previously I had been lost in all the wonderful technical data we were presenting and I had totally missed the point.
Getting to the Point of Reports
If management can not use the information to measure the businesses KPI’s or progress then the system’s usefulness becomes diminished. Managers aren’t that interested in stand alone technical IT data, what they are interested in is the high level position and trends.
Executives have a simply question,
Is the business improving or not against key metrics?
Luckily Dave had an elegantly simple idea. His simple solution was to list his divisional departments by their individual performance in the form of a sports league table. He basically wanted a simple one page league table report that the company executives could easily understand. In simple terms, the board of directors wanted to know which division was performing the best and which was the worst. He suggested that most people are familiar with sport so a league table is a universal way to illustrate performance.
Armed with this knowledge, we decided to build an on demand League Table Report. This way Dave would be able to benchmark his Website’s performance against industry competitors and other internal divisional websites.
Introducing “League Table” Reports
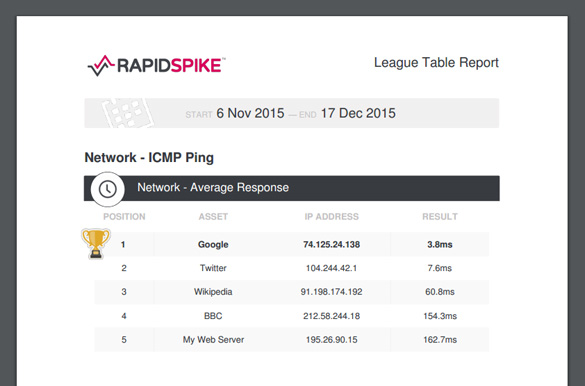
I am pleased to say that as of this week the report went live. RapidSpike customers can now measure the performance of their own infrastructure against other websites at any time instantly in the form of a League Table Report. You may think this is a bit crazy but trust me – it works! I appreciate it is of little use at a technical level but managers love its simplicity and it is a great way to illustrate and benchmark your website’s performance.
You can find the new League Table Report in the Reports section of your RapidSpike account. Happy reporting!