Clear communication is everything when it comes to service availability. Whether you’re managing a critical website, a SaaS platform, or customer-facing infrastructure, your users expect clarity, honesty, and real-time insight when things don’t go to plan.
That’s why we’re excited to introduce the newly refreshed RapidSpike Status Pages, redesigned to look better, work smarter, and provide deeper, more meaningful insight at a glance.
A Better Way to Communicate Service Health
Your status page is often the first place customers look during an incident. It needs to be fast, clear, and trustworthy.
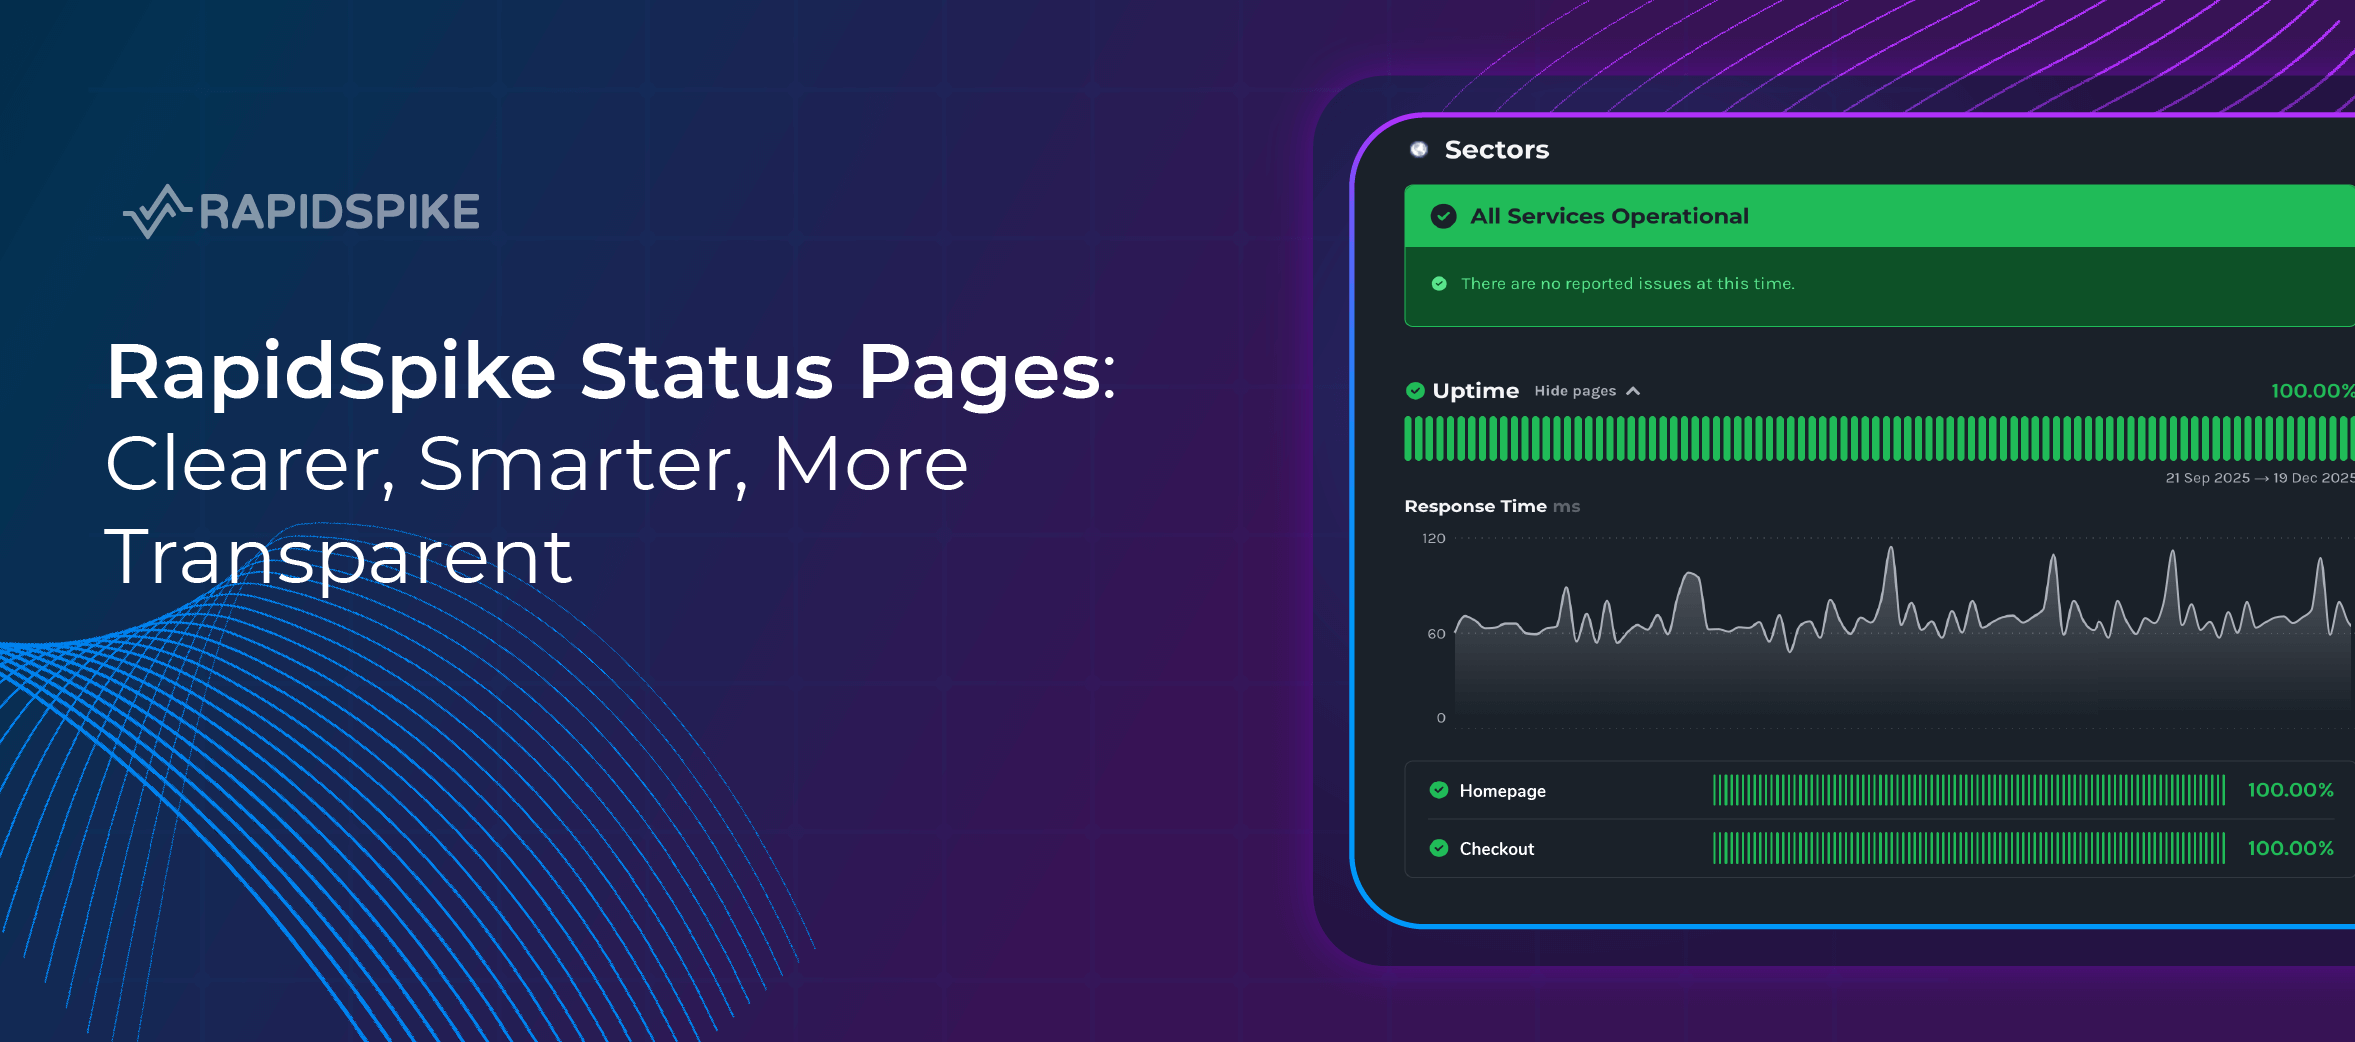
The new RapidSpike status pages bring together real-time operational data, historical performance insights, and custom branding, all in one clean and easy-to-understand view. The result is a smarter, more transparent way to communicate service health, without overwhelming your audience with technical noise.
Instant Clarity with a Clear Operational Banner
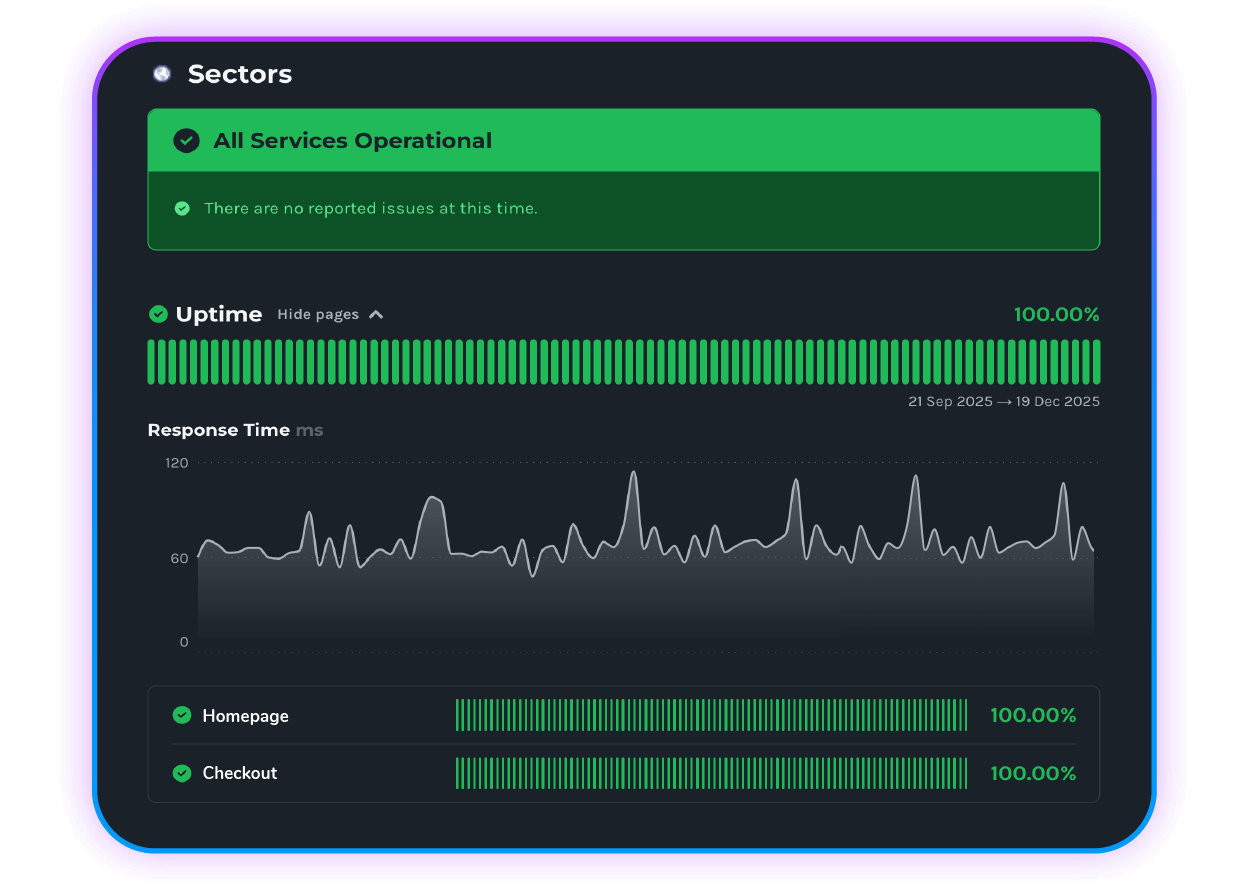
At the top of every status page is a clear operational status banner, giving users immediate reassurance or visibility of ongoing issues. No digging, no confusion, just a straightforward snapshot of how your service is performing right now.
This makes it easier for support teams to reduce inbound queries and for customers to quickly understand whether an issue is already known.
Visual Uptime & Performance Insights
Numbers alone don’t always tell the full story, visuals do. That’s why the new design puts performance data front and centre.
Uptime Graphs with Deeper Drill-Downs
Users can now explore uptime graphs at a glance, with dropdowns that allow them to drill into:
- Individual pages
- Specific monitored services
- Historical availability trends
This makes it easier to demonstrate reliability and identify patterns over time.
Response Time Graphs
Alongside uptime, response time graphs provide valuable insight into how your service is performing, not just whether it’s up, but how fast it’s responding. This is especially useful for performance-sensitive applications and customer-facing platforms.
User Journey Monitoring Where It Matters
Where applicable, status pages now include user journey information, helping teams and customers understand how real-world interactions are behaving — not just isolated endpoints.
This gives a more accurate picture of actual user experience, particularly for complex websites and multi-step applications.
Full Event History for Complete Transparency
Trust is built on transparency. That’s why we’ve made it easier to access a detailed event history report, showing:
- Past incidents
- Performance anomalies
- Key service events
By clearly documenting what happened and when, your status page becomes a reliable source of truth for both internal teams and external users.
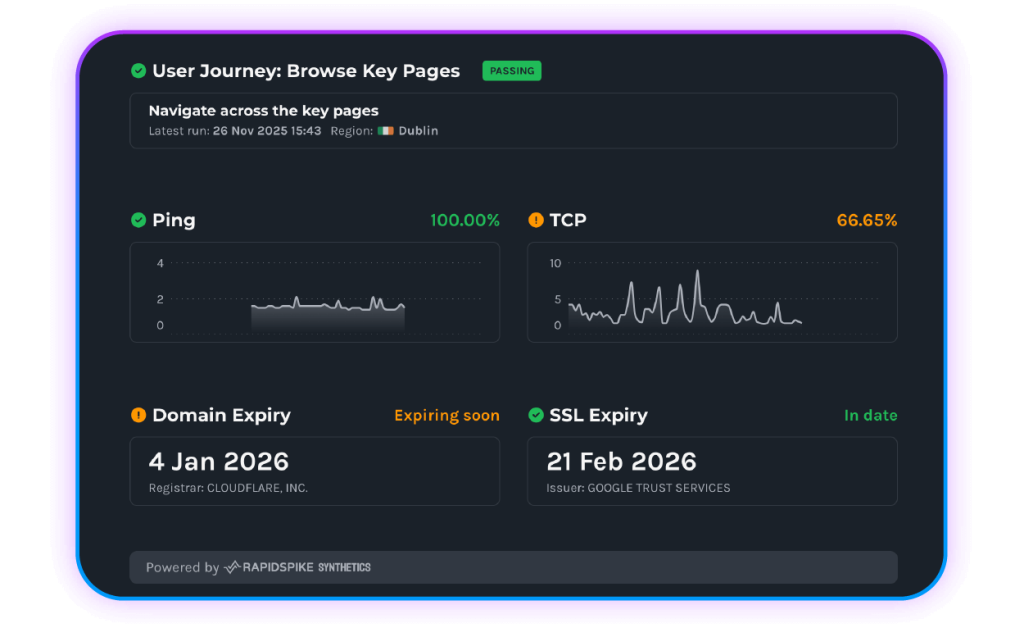
Important Signals
For those who want more detail, the new RapidSpike status pages surface deeper technical monitoring signals in a way that’s still easy to understand, including:
- Ping monitoring
- TCP monitoring
- Domain expiry status
- SSL certificate expiry details
All of this information lives in one unified view, removing the need to jump between tools or dashboards.
Fully Branded, Fully Yours
Your status page should feel like an extension of your brand, not a third-party bolt-on. RapidSpike status pages support branding personalisation, helping you maintain consistency, professionalism, and trust throughout every customer touchpoint.
Why Use a RapidSpike Status Page?
A modern status page isn’t just about reporting downtime. It’s about:
- Reducing support tickets during incidents
- Building customer trust through transparency
- Demonstrating reliability and performance
- Sharing meaningful insights, not just alerts
The new RapidSpike status pages are designed to do all of this, simply.
Create Your Own Status Page Today
If you’re ready to improve how you communicate service health, now’s the perfect time to get started.
Create your own RapidSpike status page today and give your users the clarity and confidence they expect, even when things go wrong.