The world of the ecommere is full of narrow margins and high risk. Prioritisation means focussing on one thing means skipping or delaying something else.
When speaking to ecommerce management teams a frequent topic of conversation is finding budget for site improvements. Everyone wants to have a reliable, fast website – but how can you justify the time and energy it takes to create one?
We’ll hear things like this:
This is great stuff guys, but we don’t have time to look at it right now…
Any way you could help us prioritise these issues?
Do you have any stats on how improving Core Web Vitals can benefit us?
A lot of what RapidSpike does (aside from telling you about critical failures) is warn about dropping performance, and point out where flaws could be impacting your bottom line. This is incredibly vital information – performance drops often precede a major outage, and site flaws can be anything from insidious functionality issues, third party lag or even poor accessibility.
This is great, but how do you justify taking the time to work on it?
Luckily, the stats are out there. We have a wealth of resources from highly respected brands that back up the argument that site performance, stability, accessibility are all very real conversion factors – and we have the figures to prove it.
We’ve set out to help the teams using RapidSpike justify focussing their budgets on their websites. To do this, we’ve created a Return On Investment Website Revenue Calculator that puts these figures to the test. Even better than just sharing the stats, we can also pull in real live performance data from your website and tell you where improvements will make the biggest impact.
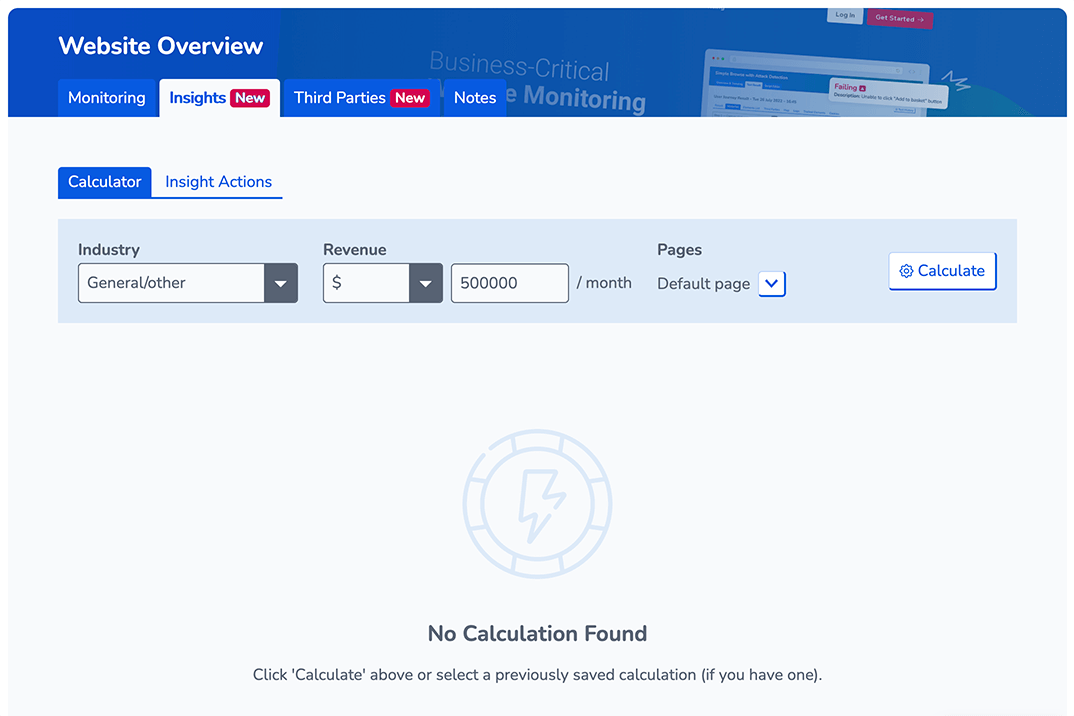
Introducing: the Revenue Calculator
Following on the heels of our brand new Third Party Dashboard we’ve updated the Insights section on your Website Overview with a brand new Revenue Calculator.
Ever wondered how Core Web Vitals impacts your bottom line?
Want to know if those accessibility tweaks are worth it?
How bad is bad? What does poor performance really do to bounce rates, revisit rates and conversions?
Just pick your industry, a monthly revenue figure and the pages you want to include.
What are these inputs for?
- The Industry toggle lets us load a conversion rate specific to your industry. We’ve collated conversion rates from a variety of sources to make sure these are relevant and accurate.
- Entering your monthly revenue means we can give you an accurate revenue impact based on our calculations. This is essential!
- Pages – our suggestion: pick your Home page, and any other pages making up a core ecommerce funnel. For example, a product listings page or search results page, and a product page. Note: we need a page with a few monitors on it for more accurate data – ideally Google Lighthouse monitoring, Page Load and Uptime.
Once you’re ready, hit “Calculate” and we’ll start pulling in your data and analysing it.
Understanding the Results
First and foremost, we have your projected revenue impact. This is the total figure we predict your revenue has been impacted. If you have included more than one page you’ll get a range, which reflects the impact if you make changes to one page (minimum), or multiple pages (total).
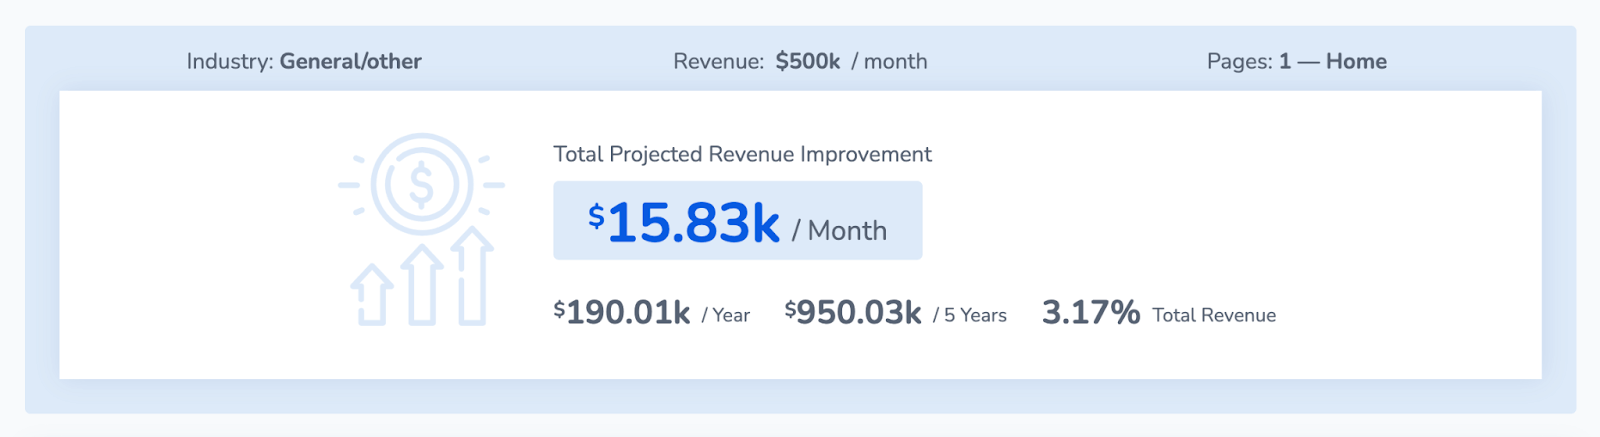
Note: The numbers you see are a conservative figure based on our calculations. The industry figures we’ve seen actually tend to be higher, with conversion rates nearing double figures.
For each page you’ll then see a breakdown of the revenue calculation, full details and all the metrics we’ve used to calculate your figures. We’ve been as transparent as we can so you can see exactly where changes would be most beneficial.
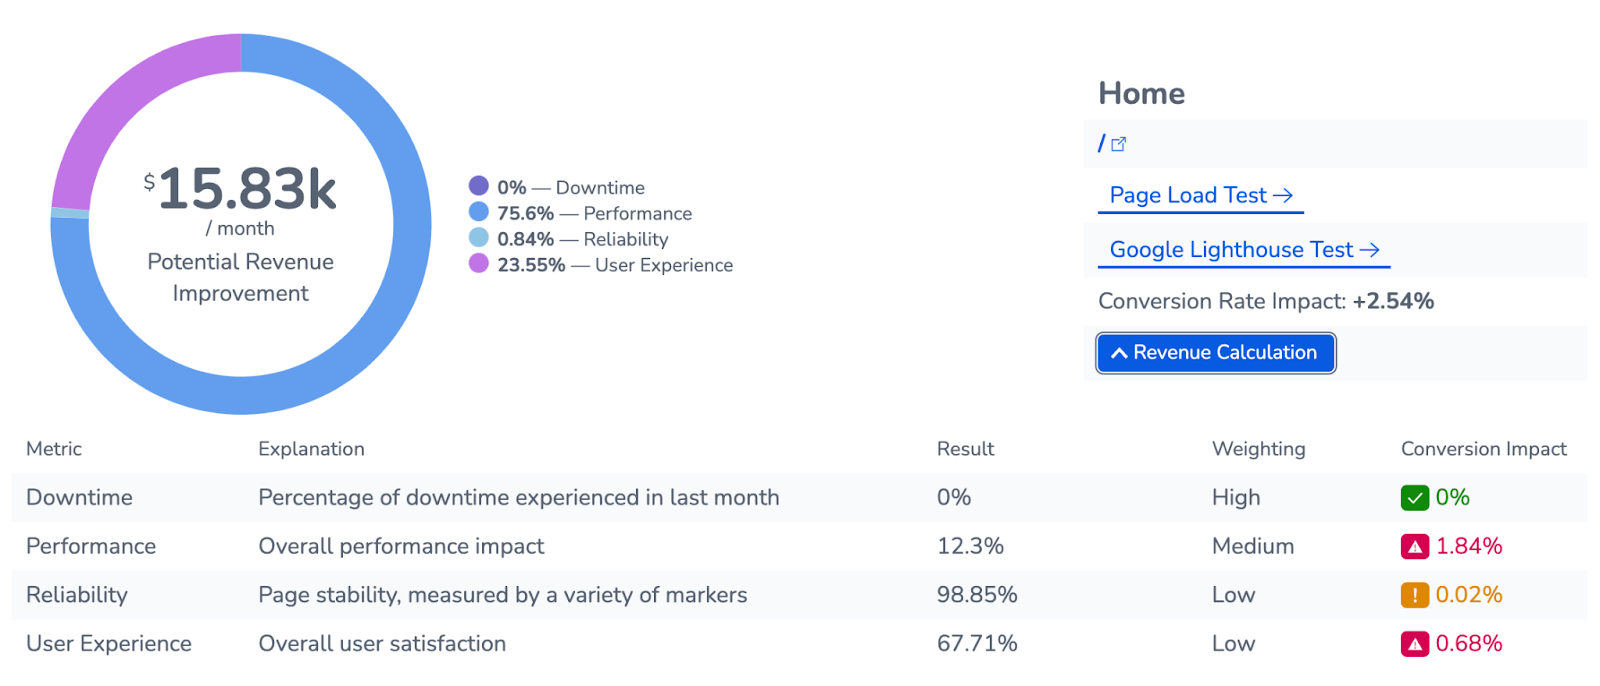
Downtime
The biggest impact on your conversion rates: if you’re down, you can’t make money. However we’ve adjusted this figure because there are other factors at play: on one hand, scheduled downtime is often unavoidable and can be minimally impacting if timed correctly. (Note: we recommend setting up Maintenance Windows in RapidSpike so your downtime does not affecting your monitoring stats)
On the other hand, genuine downtime can also impact your site revisit rates as customers are less likely to return to a site where they experienced issues! Put another way, unexpected downtime also does reputational damage.
Industry Benchmarks
We built this calculator based on industry-wide metrics, so we thought it a good idea to include some of them as benchmarks. We’ve listed a range these sourced from major retailers and other well known brands where you can examples of real-world performance (and reliability) impacts.
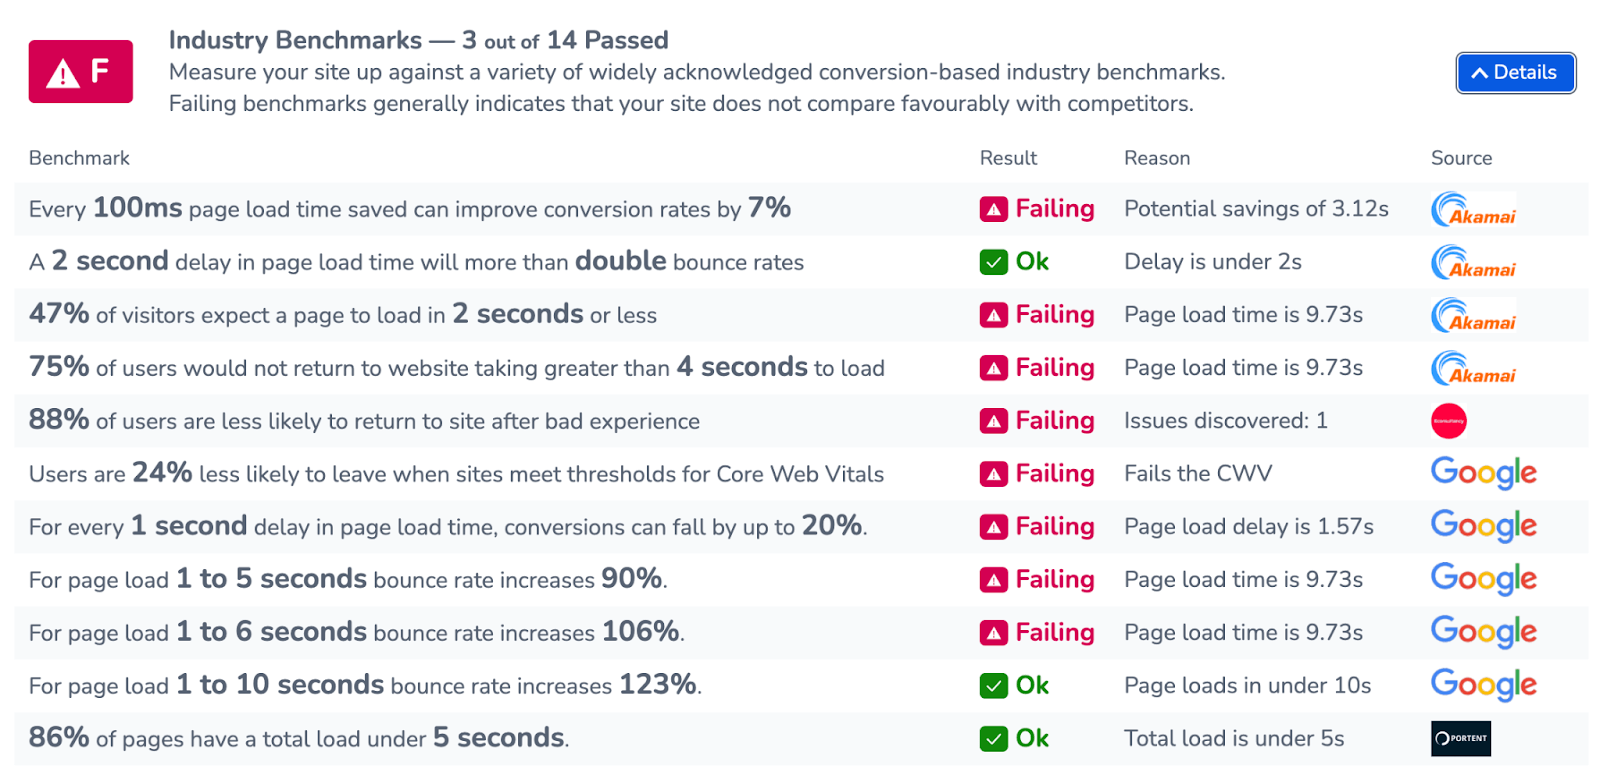
Your benchmarks score doesn’t contribute to the overall revenue figure at the top of the page. However, these metrics are where our revenue calculation comes from – so generally the better you do here the less your revenue impact will be!
Page Performance
Page Performance has a significant impact on your conversion rate – as we can see from industry benchmarks, small gains in page load can make a big difference to your revenue. We measure a few metrics here:
- The total potential gains from “quick wins” suggested by Google Lighthouse that could speed up page load.
- The distance to “optimal page load” as defined by Google. This is currently 2 seconds – so every second above that starts to impact your conversion rate.
- Performance Rating, which is a measure of overall performance across a wide range of metrics.
Page Reliability
Reliability – or more accurately ‘stability’ – is a tough one to measure. We’ve tried to do so here by tracking the quantity of smaller issues experienced on your site, as well as the bigger issues that might see visitors unable to load pages entirely.
We know that console errors, element errors and so on are a fact of life in the modern web, but a high frequency of errors can often be an indicator of a larger problem. We have adjusted the weighting of each metric so that it impacts differently on your total revenue and conversion rates, as well as using a sliding scale for downtime and other issues.
User Experience & Bounce Rate
User Experience is measured by Google CrUX (Chrome User Experience) metrics, plus a variety of other metrics including overall accessibility, which covers things like font sizes, colour contrast and screen reader support.
The thinking here is simple: good user experience means better revisit rates and lower bounce rates. More accessible websites will naturally lead to more conversions, because a wider audience is able to use the site.
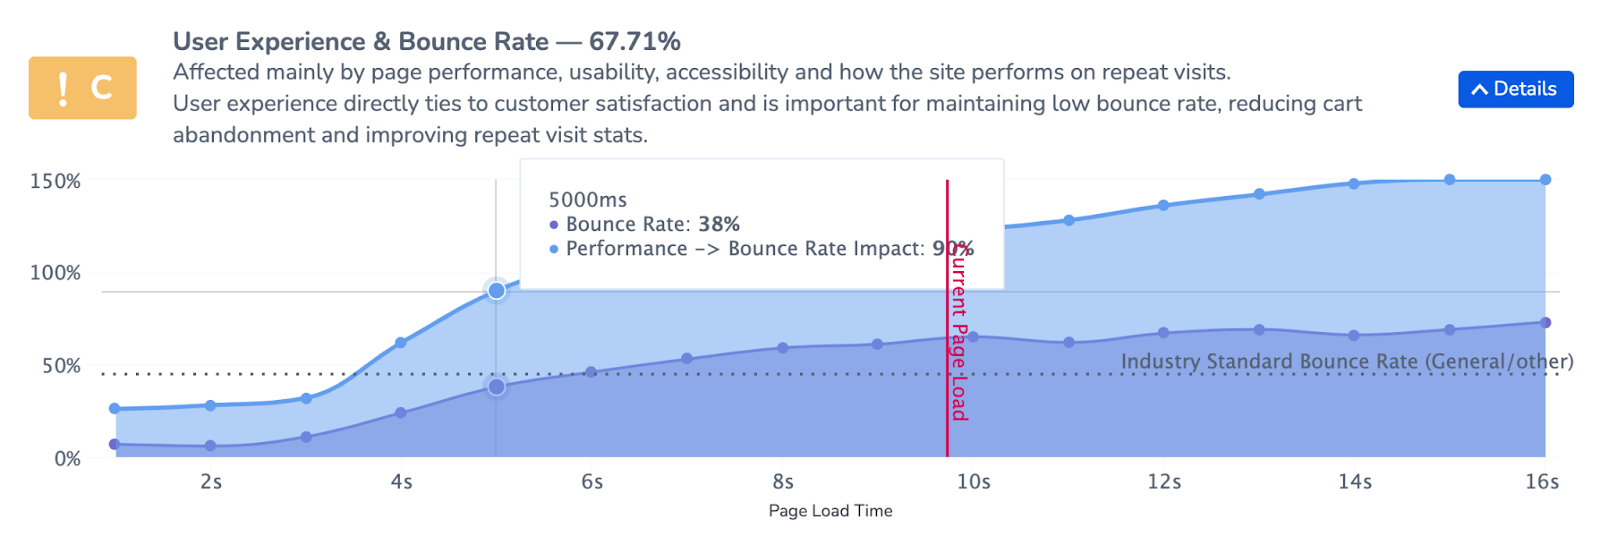
We’ve also included a graph so you can track bounce rate plotted against page load. The graph includes a line for your industry standard bounce rate and a marker showing where your page loaded. Essentially, the quicker the better.
Calculating Performance Impact on Revenue and Conversion Rates
Coming up with an overall calculation for the impact of performance on conversion is not easy. Every site and every industry has its own quirks, every metric impacts differently, and many metrics impact each other in different ways.
We are lucky that within RapidSpike we have a huge amount of data to read from so we can pull together a comprehensive calculation that accounts for all these factors. We think the end result may surprise some – but the industry benchmarks are there to prove that, if anything, we’ve been cautious in our figures!
We hope that the calculator proves a vital tool for ecommerce teams who are looking to justify increasing budget, whether it be on reliability, performance or accessibility and user experience.