
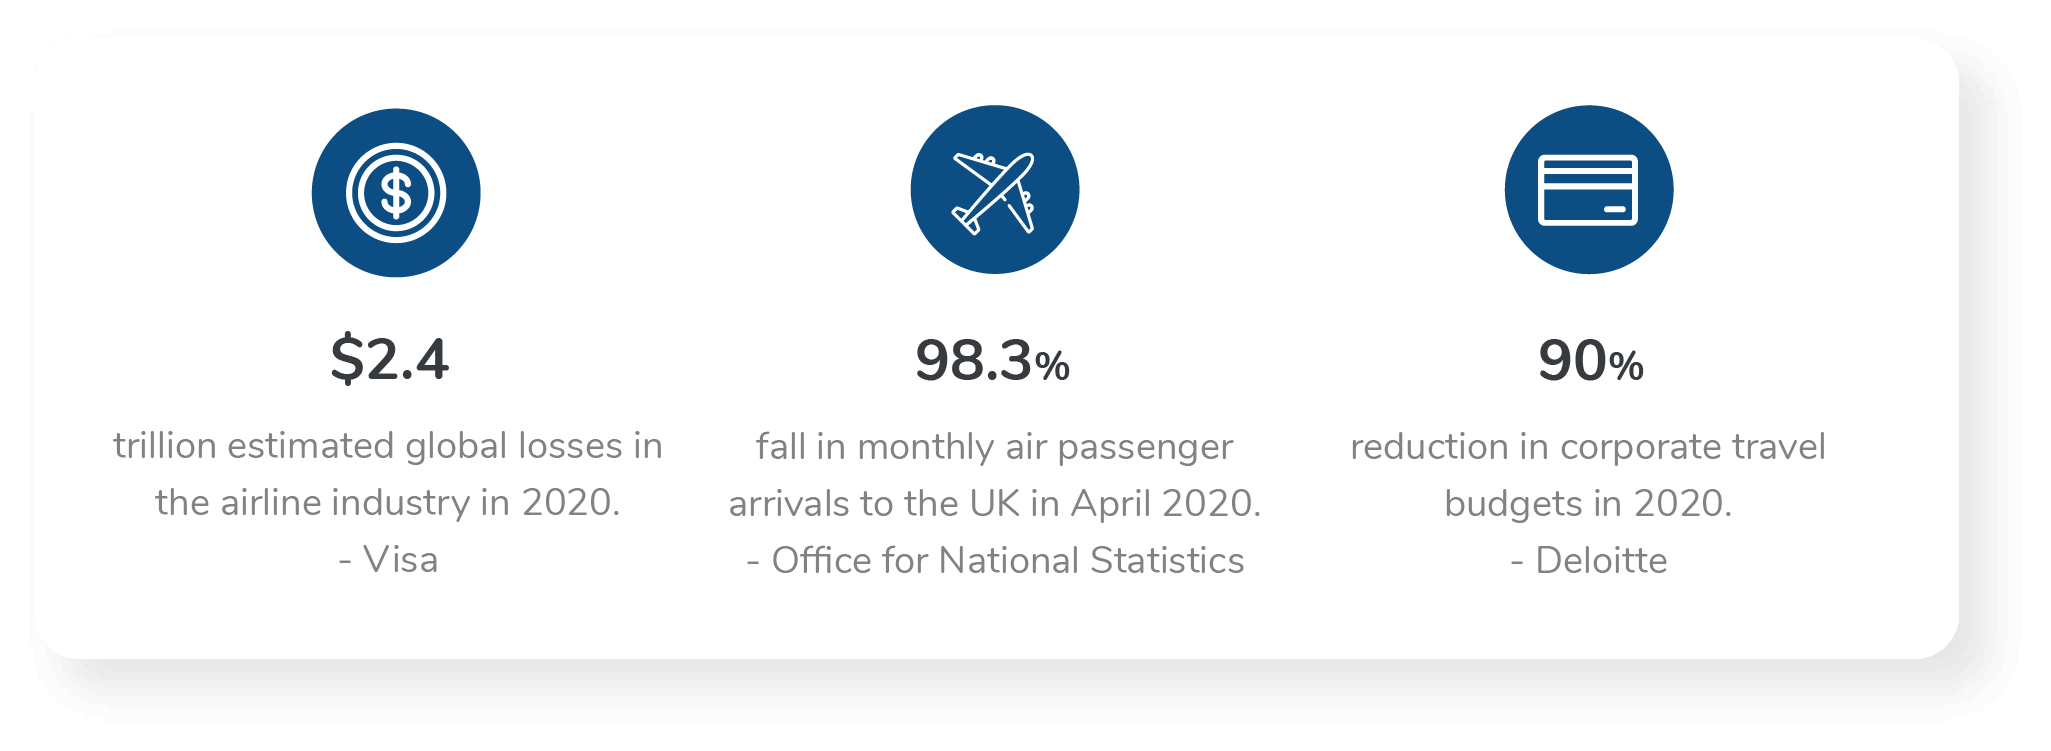
The travel industry was hit harder than any other industry throughout the pandemic. Frequent changing of rules and restrictions resulted in multiple setbacks. Travel companies had significant difficulties navigating the field and it wasn’t without devastating losses. The Office for National Statistics (ONS) data shows that turnover in travel and tourism businesses declined to 26.0% of February levels, compared with 73.6% in all other industries. Visa predicts that the global travel industry loss was an estimated $2.4 trillion. The timeline of events affecting the travel industry during the pandemic has been vast. In this timeline, we have highlighted key events for selective countries.
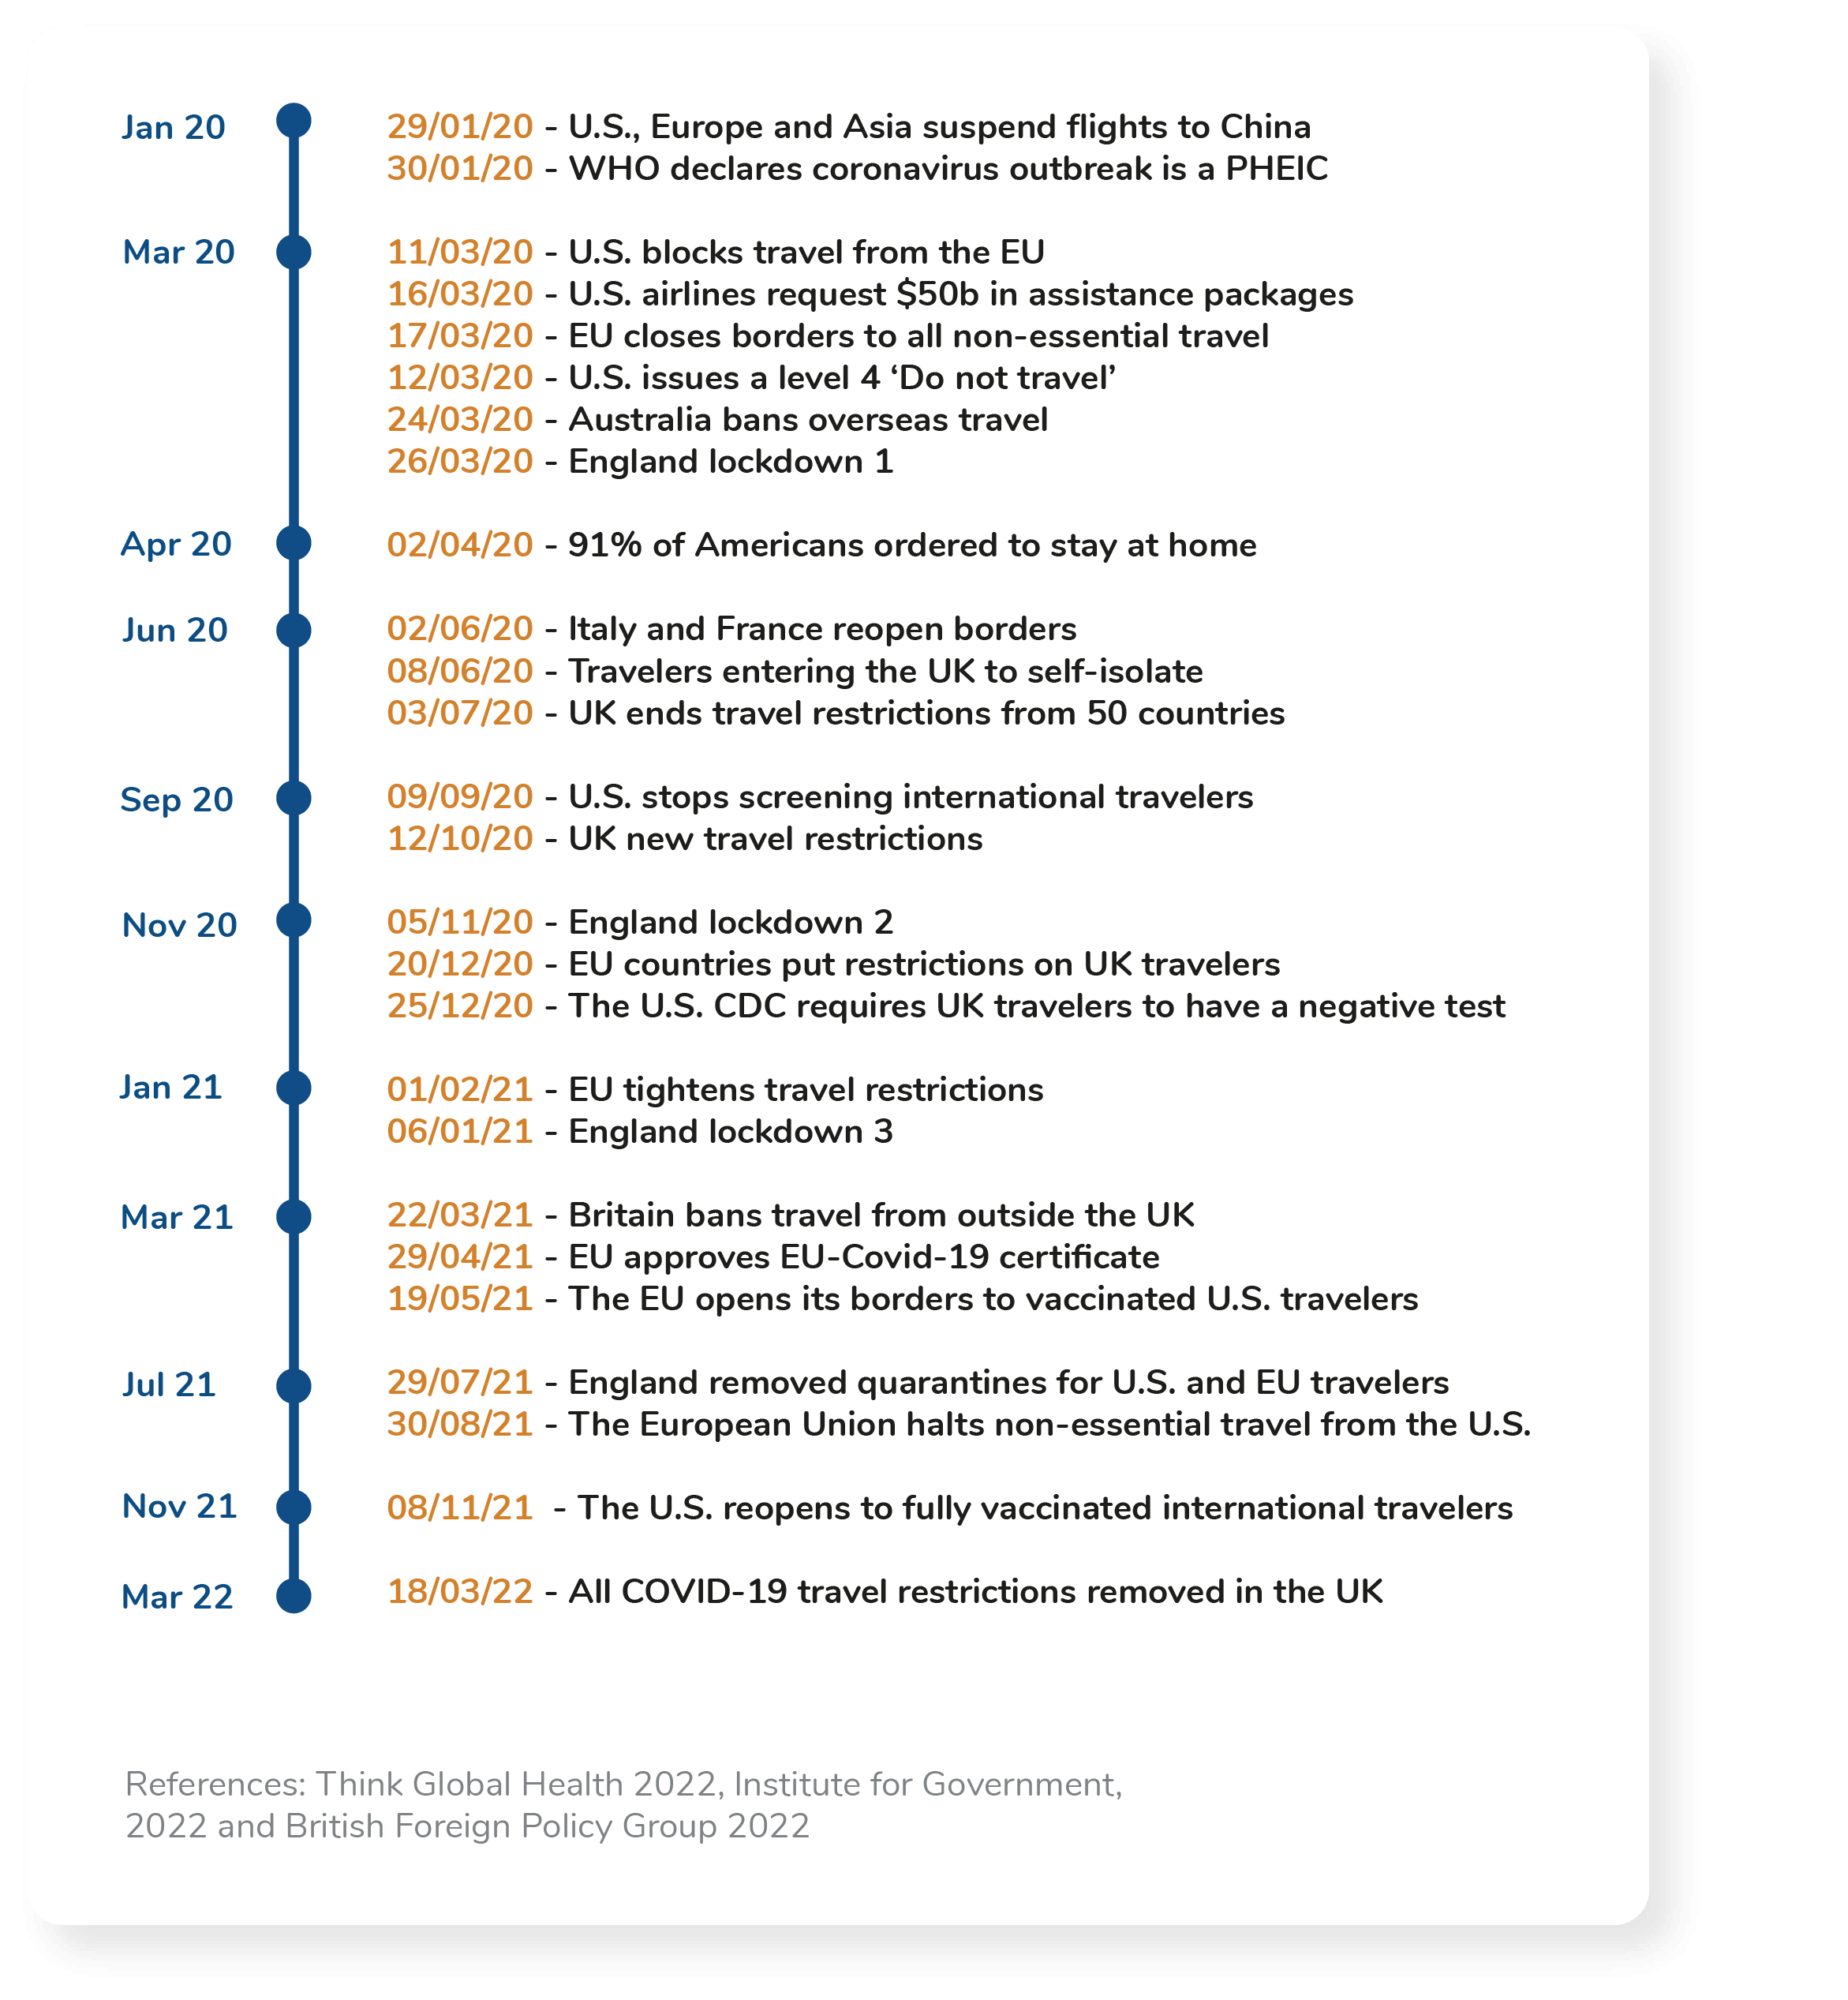
At the start of the pandemic, it was expected that by restricting travel to China, the virus could be contained, however it is now known that widespread contamination of the virus had already occurred in early January. The first large-scale restrictions came in March 2020, with multiple countries going into lockdown. A group of US airlines requested $50 billion in assistance packages to deal with the financial damage already caused by the pandemic. The ONS reported monthly air passenger arrivals to the UK fell from 6,804,900 in February 2020 to 112,300 in April 2020, a fall of 98.3%. Non-essential international travel was the first to be restricted on a global scale, however research from Deloitte shows that business travel also showed significant reductions with most US-based companies’ travel budgets declining by 90% or more beginning in early 2020.
During the pandemic, various attempts were made for countries to open up travel, tourism and borders, however this proved to be continually challenging. The pattern which followed included countries opening their borders, seeing an increase in covid cases and then shutting down travel and reinstating restrictions. Reopening travel came in November 2021 for the U.S., and in March 2022, the UK removed all travel restrictions, however, there are still measures in place on a global scale to prevent the spread of the virus. Travel has finally seen more consistent levels of consumer engagement, and although not back to pre-pandemic metrics, the trajectory is looking positive for the industry.
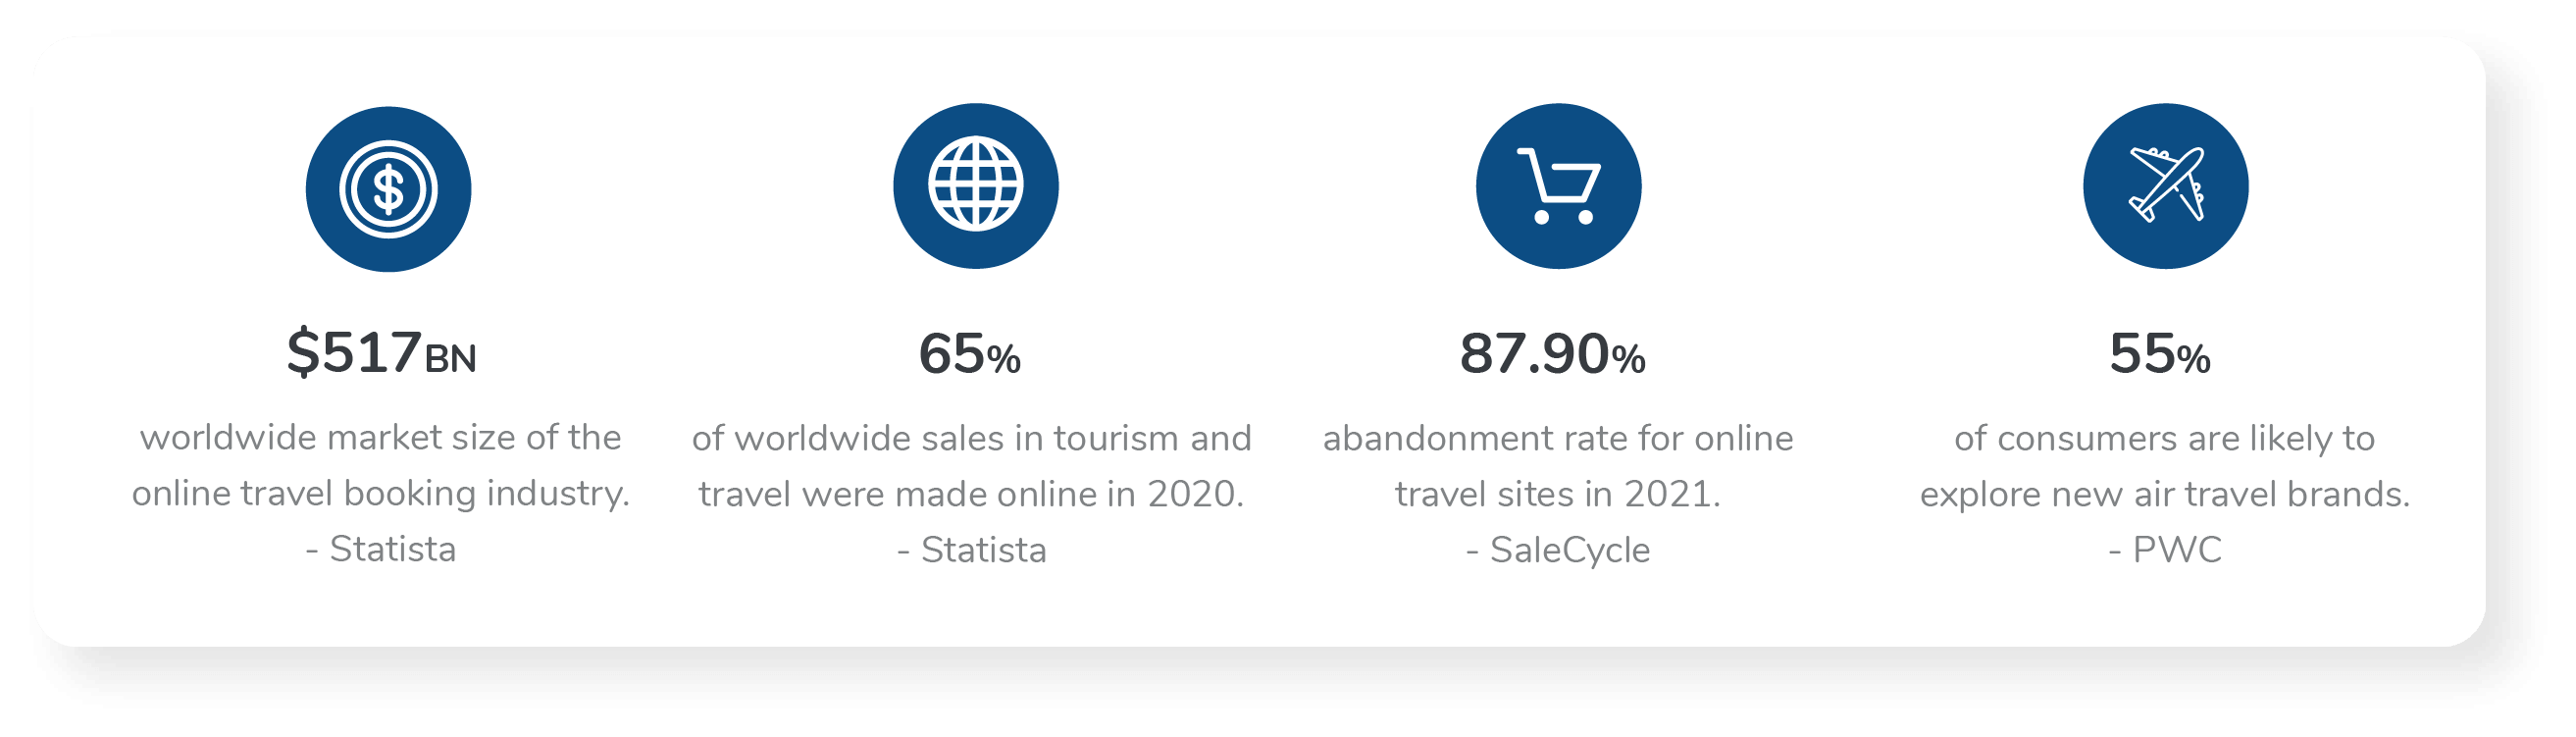
The ecommerce landscape had a paradigm shift during the pandemic, websites had to transform to meet a wide variety of new consumer needs and demands for digital booking options. The market size of the online travel booking platform industry worldwide amounted to roughly $517.8 billion in 2020, and although the travel industry has always had a strong online presence, the pandemic has accelerated this further. According to Statista, digital bookings championed with 65% of worldwide sales in tourism and travel being made online in 2020. Brick-and-mortar sales dropped significantly due to restrictions and primarily in-store travel brands suffered. Hays Travel, a predominantly brick-and-mortar brand, reported a loss of more than £34 million in 18 months to April 2021.
Travel purchases tend to be more of an investment for consumers, therefore consumers take time to browse deals. Not only does this cause high competition in the industry, but it also leads to high cart abandonment rates. SaleCycle reported the average abandonment rate for online travel sites was 87.90% in 2021, with an abandonment rate of 85% on desktop and 91% on mobile. Therefore customer user journeys need to be reliable, fast, and secure for brands to compete.
Travel websites are typically highly complex with advanced user journeys, third parties, large imagery, and videos. Usually, the travel industry is well-prepared for changes to regulations and restrictions to services, however during the pandemic, travel companies have had to continuously change web pages to keep their website up to date with current events. Website functionalities changed to reflect this including additional third parties such as Live Chat. These changes can have serious implications for user experience, performance, and security.
Due to the complexities of travel websites, they are not fully optimised for mobile, despite not being the core device for booking travel, they do have a purpose and therefore website owners should correctly optimise mobile sites. Most consumers will not use a smartphone to make their purchases but to browse. SaleCycle explains how 70% of all customers do their research into holiday bookings on a smartphone, however 80% of users in the United States still prefer to use their desktop or laptop when making a booking.
Consumers can be more loyal to user experience or price than brand loyalty and this appears to be true for travel websites, PWC reported that 55% of consumers are likely to explore new air travel brands. Therefore it is more important than ever for travel websites to focus on creating a good user experience. Google’s new user experience initiative Core Web Vitals has now rolled out and travel brands should aim to pass these metrics to compete.
In the latest industry report, we explore the leading travel websites and explain how to build a website strategy to surpass the competition, improve customer experience and avoid data breaches.