Last week, we were thrilled to launch a new website overview dashboard in RapidSpike: the Third Party Management Dashboard.
Late to the Party?
Speaking to clients over the past few years we’ve heard again and again about the importance of tracking third parties.
Live chat and support plugins, tracking and analytics, payment gateways and postcode lookups – third parties are everywhere. They’re also pretty essential to the running of modern ecommerce sites, for adding basic functionality, support and marketing purposes.
However as soon as you load a third party onto your site you open yourself up to a world of troubles, and this has ecommerce managers, security teams and site reliability experts fretting.
A new third party might slow down your site, even if it’s not loading something essential. They can open you up to security issues (see our Magecart posts). And sometimes when they break – well you this might just mean your site is unusable.
Enter RapidSpike Third Party Management
We’ve had third party management in our app for years. You may be aware that our Page Load monitors and User Journeys both collect third party data – we display this in the test results for those monitors.
These monitors gather information on basic performance, files loaded, size, headers and so on.
Our Google Lighthouse monitoring also picks up third party data – in this case focussed on where third parties have blocked the main thread or where javascript had unnecessarily long tasks to run.
We added new third party views to Google Lighthouse in early 2022. However, we always wanted to go further, and now we have.
A More Complete Picture Than Ever Before
Here’s our new third party dashboard:
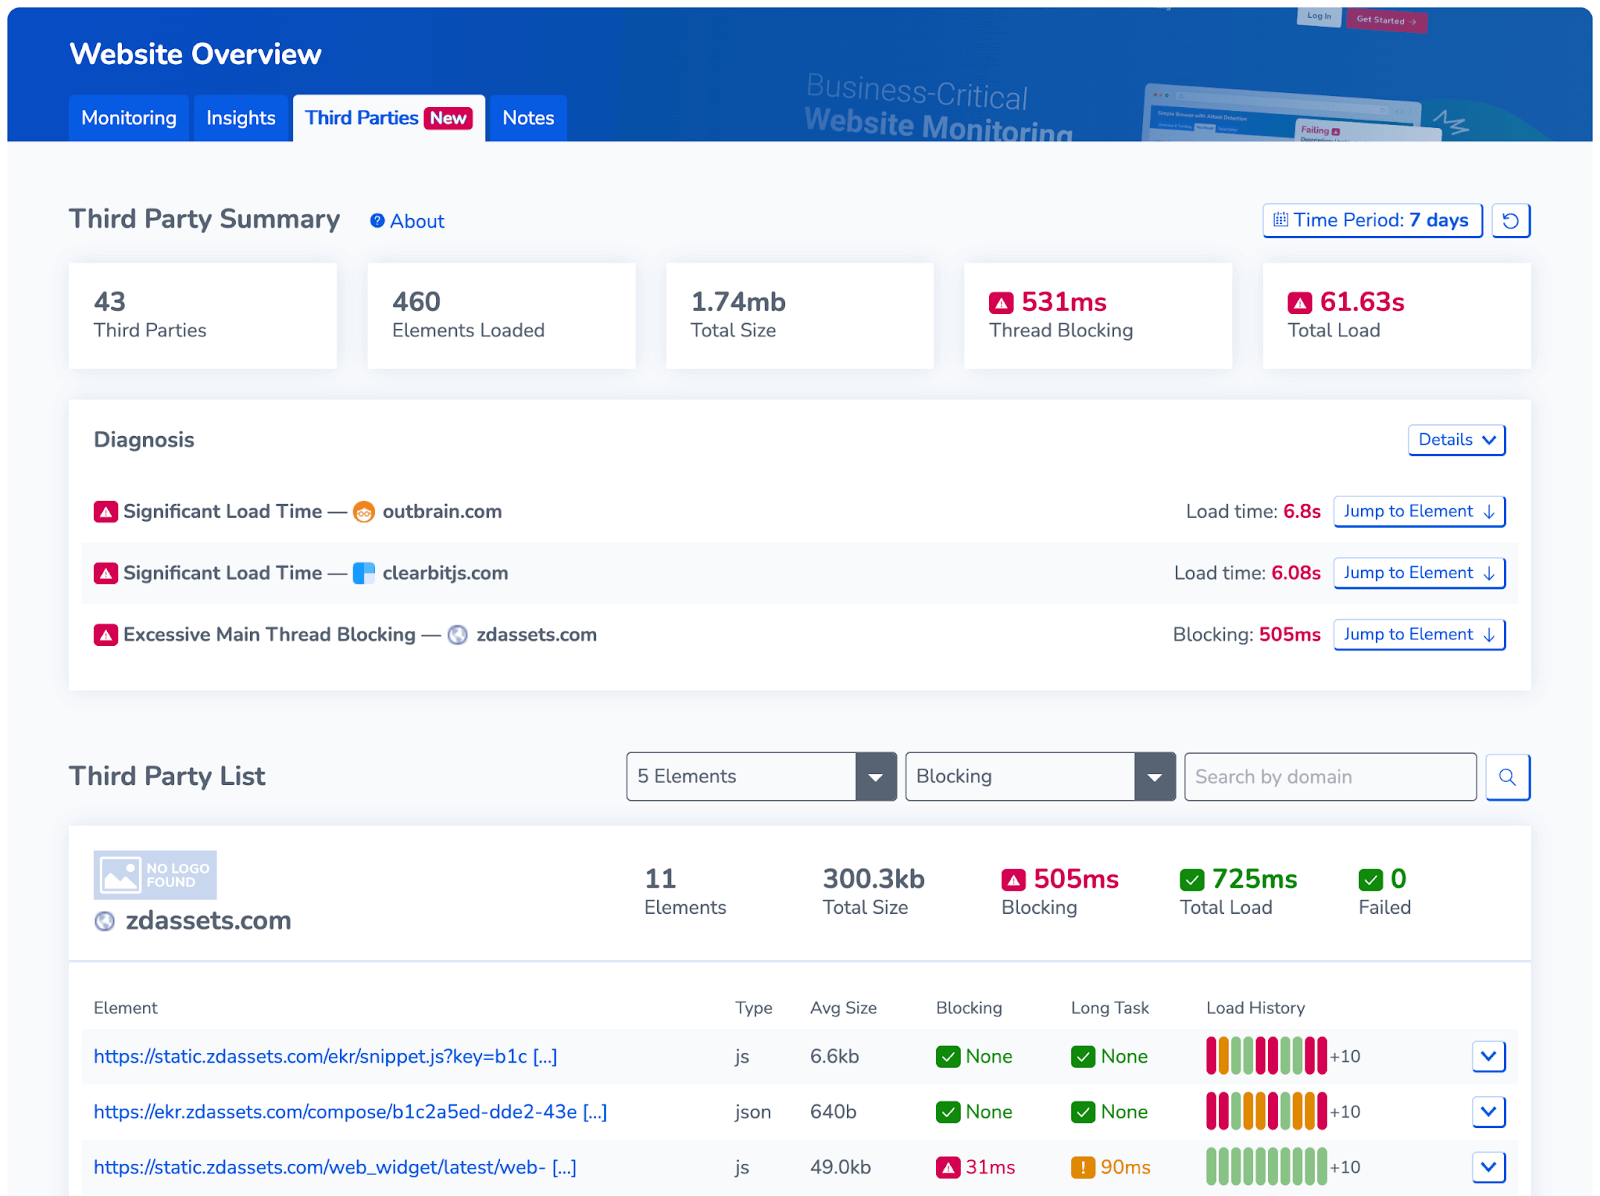
Found on your website overview, it’ll analyse your most recent test results from a variety of pages and user journeys, from Google Lighthouse and page load monitors. It takes that data and matches it up with older test data (a week ago), then it combines, organises it and pulls out highlights (or lowlights) to focus on.
In short, it’s the most complete view of your third parties that you’ll find anywhere on the web.
The third party dash will run for any site with at least one user journey, page load or Google Lighthouse configured. What’s even better is that the more you monitor, the more data we will be able to pull: full ecommerce user journeys access part of your site that ordinary monitoring cannot, and we’ll be able to track third parties right in the heart of your key processes.
Focus On Features
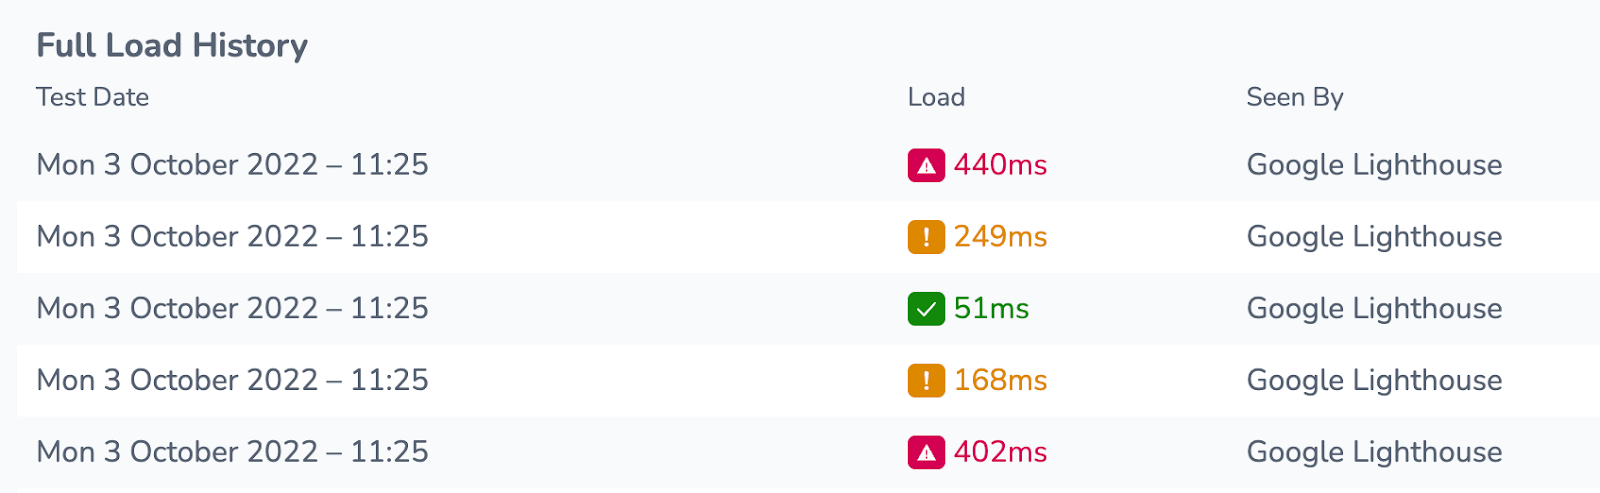
Managing your third parties just got easier. See all the files we’ve encountered whilst monitoring your website and view a load history to see what files are quick and which ones could be causing you grief:
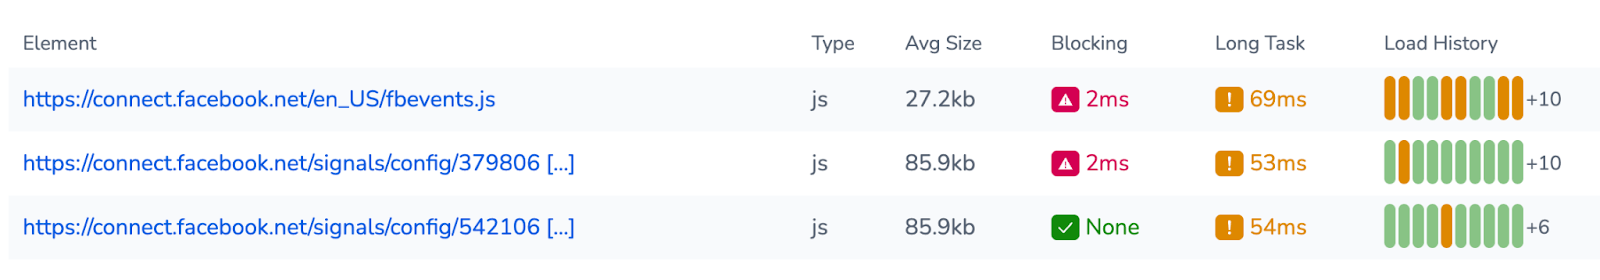
Open up a single file for deep dive into every test result where we encountered it:
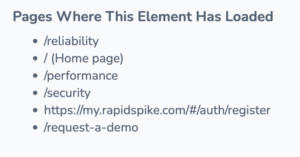
We’ll even link to the pages we saw the file:
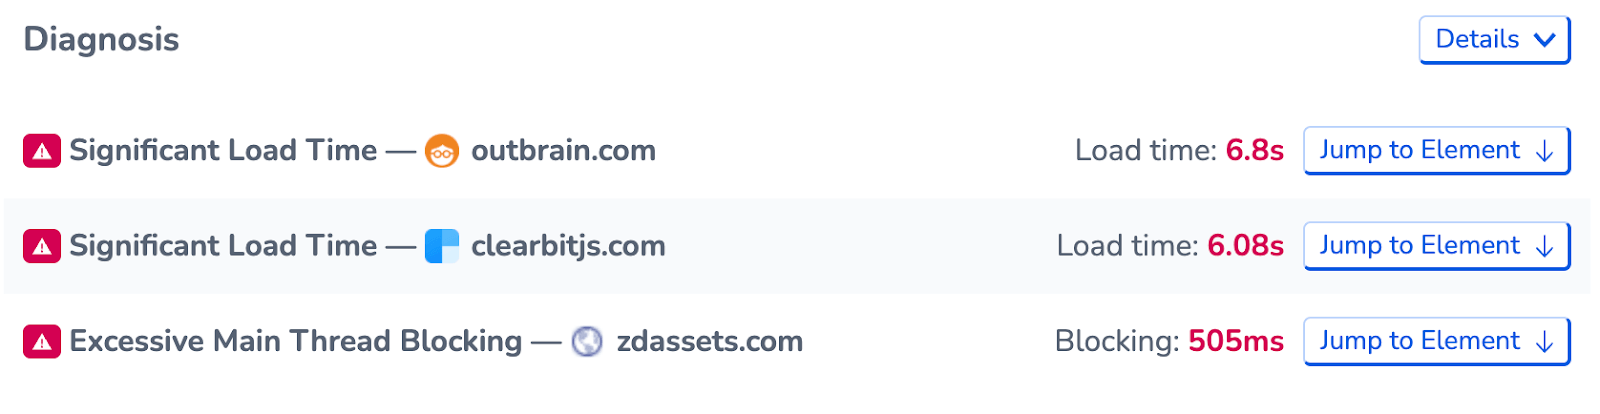
The diagnosis panel highlights potential problem elements, including overall slow loading, thread blocking and frequent element failures like 404s:
In summary
We’ve designed the new dashboard to give you the greatest possible insight into third parties using the data we have. This might mean baselining load times, making judgements on managing and removing troublesome third parties, optimising site performance and much more. We hope you find it useful!