This morning we launched a new update for the RapidSpike App. This update includes a totally new Dashboard experience for our users.
Our old dashboard – or “Home” screen – featured a number of fairly static graphs and charts showing your account usage. We felt that this screen was badly in need of an update to show off the cool and exciting facts and figures RapidSpike can generate.
Not only that, we also needed a way for our users to customise their accounts. RapidSpike has such a wealth of tools that our customerbase ranges a great deal.
Not everyone is interested in Availability (uptime); some users are focused purely on our Security tools. Many of our customers only want their Performance metrics. Some use RapidSpike to keep on their SEO statistics. We even have customers who only use RapidSpike for an ecosystem overview, and monitor their devices using our Connect Anything monitors.
So how do we keep everyone happy?
The answer is pretty simple: give users the tools to pick and choose what monitors they can see.
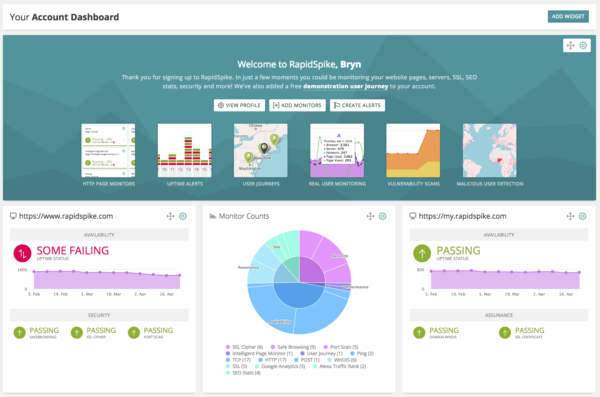
The new Home screen is now built up of a set of widgets. You can add or remove each widget whenever you like. You can also reorder widgets by dragging them around into the order you prefer. The app will save your changes so when you come back everything will be as you left it.
What does the new Dashboard show?
The first widget all users see is a “Welcome to RapidSpike” banner. This gives you some useful links and an overview of some of the fantastic tools we’ve built.
The other widgets we’ve created will let you monitor your account, giving you headline stats on how many monitors you have, what type they are, and so on. We’ve made widgets that track your Uptime monitors across both Servers/Devices and Websites.
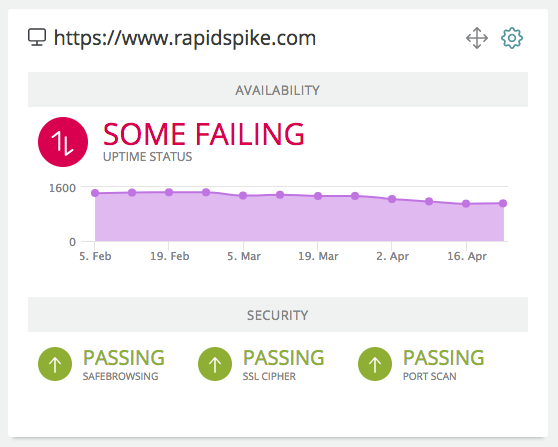
The most advanced widgets are customisable. You can specify a “Critical” server or website from your account, then choose what stats you’re interested in. So far the choices are Availability, Security and Assurance. The widget will then show the headlines for that server/website. If you picked Security and you have Vulnerability Scans running, this includes a trend graph of recent scans so you can see how you’re improving.
For brand new users, the “default” widgets added to your Dashboard will display some sample data so you can get an idea for how it will look.
Coming soon
We launched the new widgets today, but there’s still plenty more for us to do. In the coming weeks we’ll releasing more widgets for you to use. In particular we’d like to add Performance data to your dashboard, so you can get trend graphs and live statuses from your User Journeys, IPMs and RUM data.
So what are you waiting for? Log in now and set up your Home screen just how you like it!