Following on from our Slack and webhook integrations for uptime monitoring, you can now add PagerDuty integrations to automatically raise, update and resolve incidents within PagerDuty.
As with all of our Uptime Monitoring notifications, we group together all the alerts into one incident. This means if a server goes down with several websites and multiple monitors, you won’t have a flood of incidents in PagerDuty.
Create a new service in PagerDuty
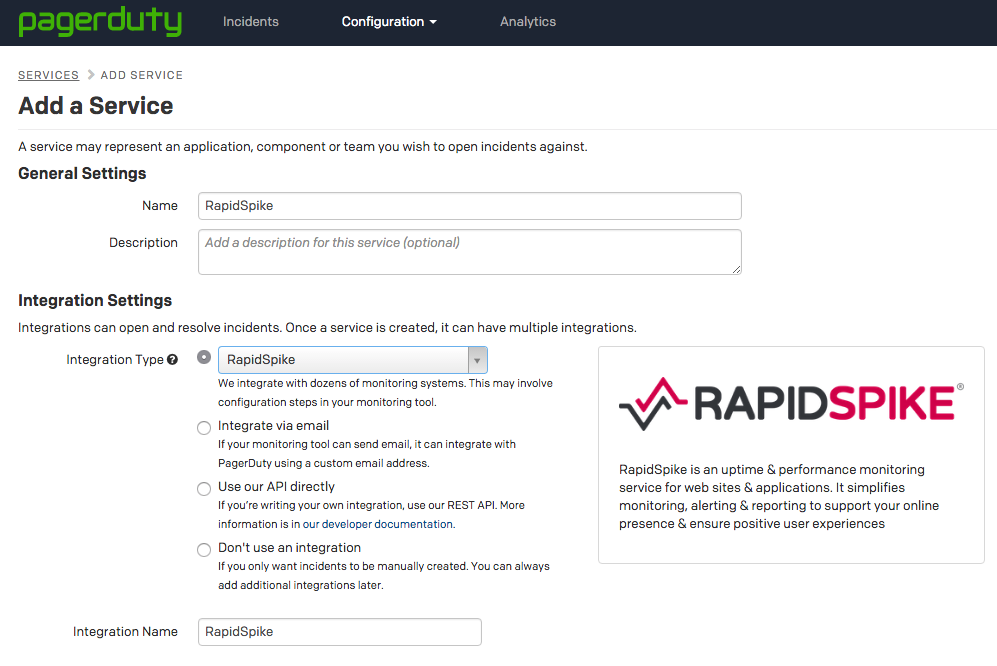
First you will need to add a new Service to your PagerDuty account, this allows RapidSpike to raise PagerDuty incidents automatically.
- Go to the Services page in your PagerDuty account and click the “Add New Service” button.
- Enter a name for the service (e.g. “RapidSpike”) and select “RapidSpike” as the “Integration Type”.

- Configure your escalation policy and settings under “Incident Settings” and click “Add Service”.
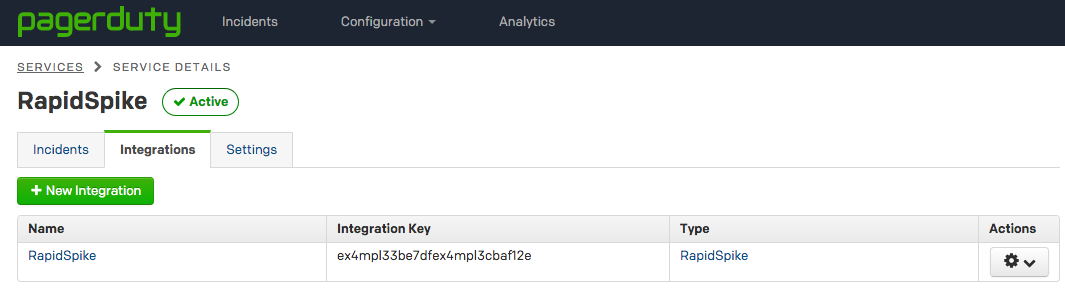
- From the Service Details page, make a note of your “Integration Key” – this is what’s added later to RapidSpike.
Create a PagerDuty integration in RapidSpike
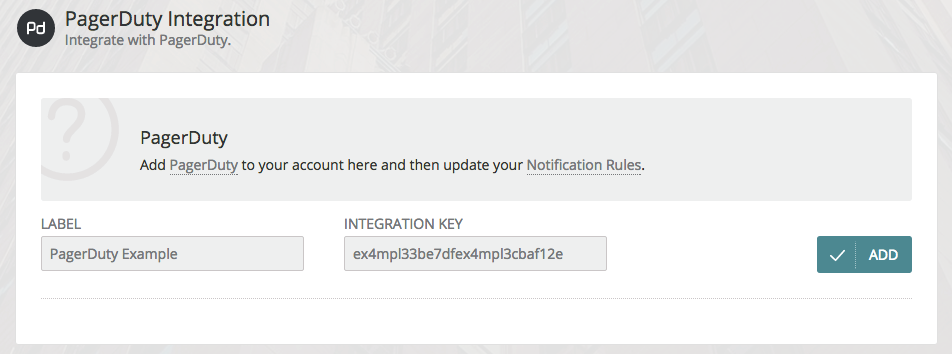
Once you have an Integration Key, you need to add it to RapidSpike.
- Go to the Integrations tab in your Account Settings in RapidSpike.
- In the PagerDuty Integration section, add you Integration Key and click “Add”.
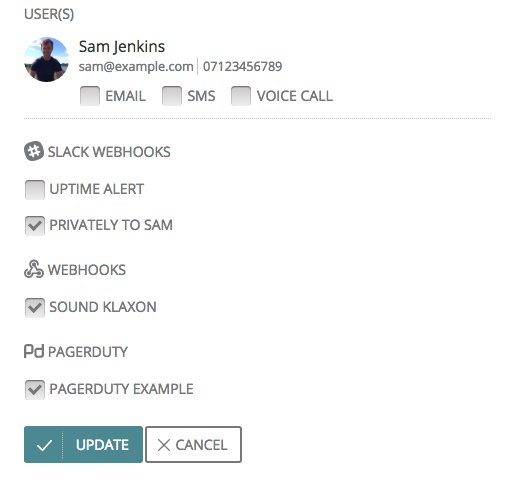
Update your notification rules
- Go to your Notification Rules in RapidSpike.
- Add or edit an existing notification rule. Select the new PagerDuty integration from the list of options.
The next time you’re unfortunate enough to have failing monitors, we’ll raise the dispute in PagerDuty.
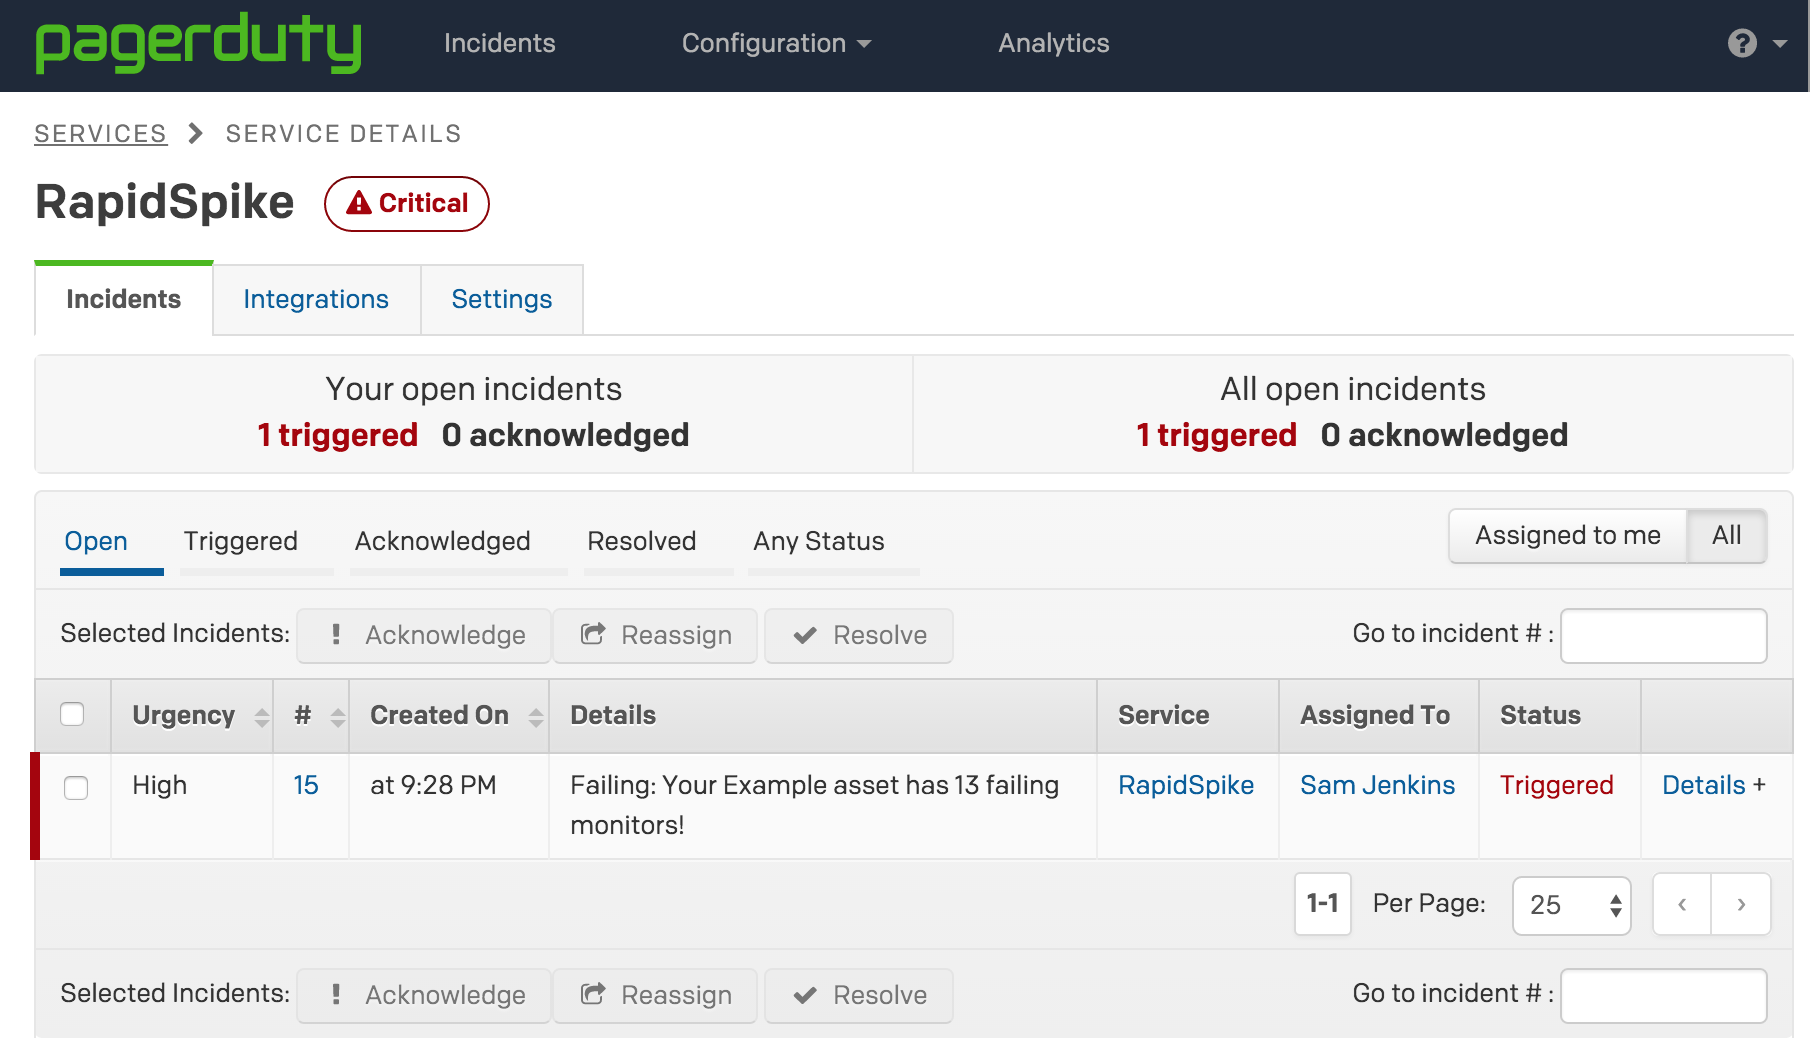
If we detect more failing monitors on the same asset, we’ll update the current incident in PagerDuty. Once the asset is passing, we’ll mark the incident as resolved.