Performance and security are the lifeblood of an e-commerce website. The moment pages start to slow down, or your customers fear their data may be at risk, is the moment your business starts to fail.
This post is the second in a series of three that will explore the key tools every ecommerce site needs running 24/7.
» See the first post here (User Journeys).
Does my website perform well for everyone?
Tool: Real User Monitoring
Real User Monitoring provides some of the most informative and useful performance data it’s possible to get – and for one simple reason. The performance data is generated directly by real people, browsing your site in real time.
Unlike synthetic checks, Real User Monitoring observes real live internet traffic and records performance, warts and all. This means your stats may include all sorts of results, including users with slow, outdated phones connecting from remote places across the world.
Real User Monitoring is great for learning some key stats about your site:
- Demographics and Performance
Learn how you perform on mobile vs desktop, or with traffic from France vs Germany, or users on Chrome vs Firefox, etc. - Individual Page Popularity vs Performance
What are your most trafficked pages? How do they handle spikes in visitors? - Performance by Hour
What are your peak hours? How does your site & infrastructure cope at these times?
Setting up a Real User Monitor
Let’s go through the process of setting up Real User Monitoring on a website.
First we add the website to RapidSpike, then we choose to Add a Monitor to that site. In this case, we choose Real User Monitoring (RUM).
This process completes with a message – Setup Required. This is because for Real User Monitoring to work, we need to place a lightweight Javascript snippet on your website to track users.
[Note: The Real User Monitoring Javascript operates in a similar way to Google Analytics – it records no personally identifiable information about users.]
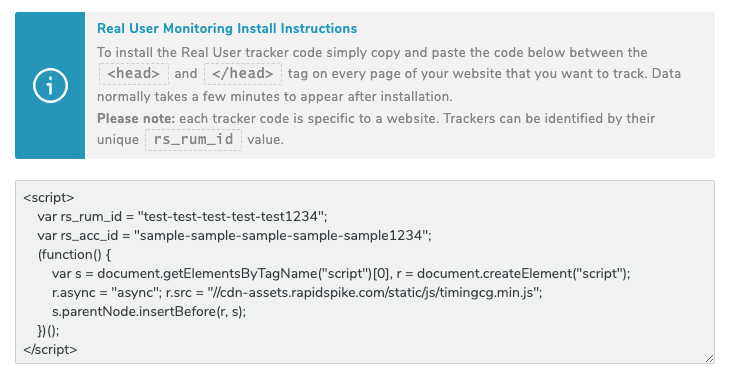
The first step is to copy the Javascript snippet (see above). Each tracker has a unique website ID and is tied to your account ID.
Then using Google Tag Manager (or similar), or simply by copying and pasting in to the source code, add the tracker to your site’s <head> tag.
Performance data will begin recording straight away – although there may be a short delay before it begins to appear in your account.
Performance Deep Dive
Now that Real User Monitoring is live, all you need to start populating your dashboards is traffic. The main dashboard gives you an overview of traffic and performance:
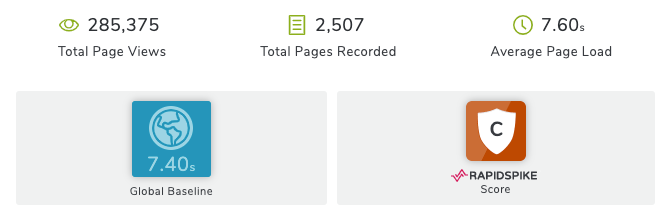
Whilst the “Results” and “Browse Data” sections give you more detailed, in-depth look at user demographics and the pages of your site.
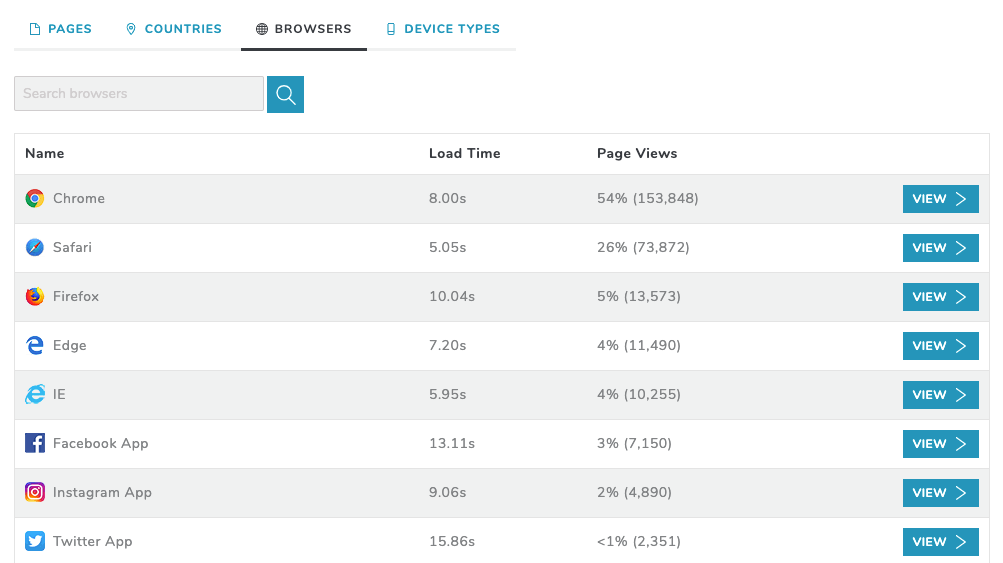
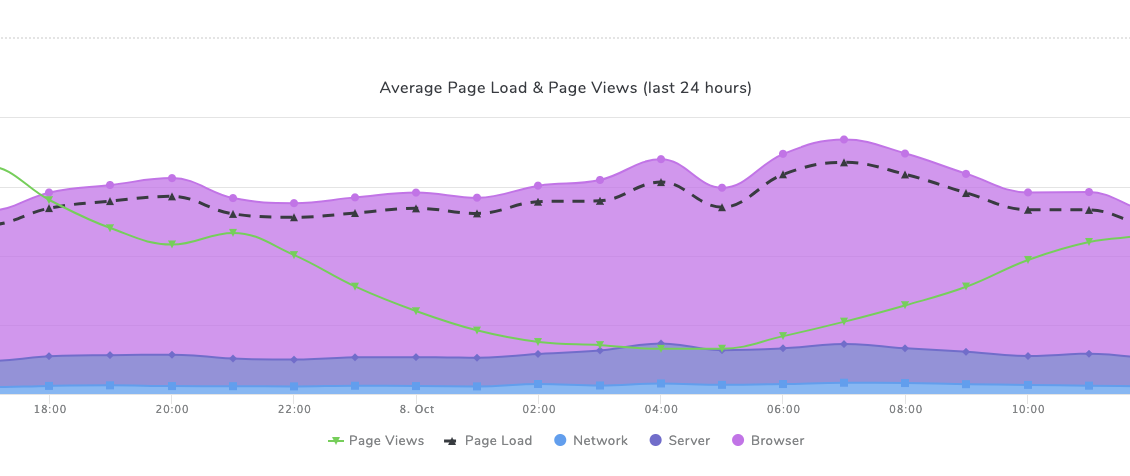
You can even drill down further, by clicking a browser, country, device or page you can then see the data just for that selection. Here’s Chrome performance over the past 24 hours:
Performance and Traffic Alerts
Real User Monitoring is not just great for pages of data, graphs and stats. You can also make your monitoring proactive by configuring alerts based on a wide range of conditions. This is great for tracking unusual events that might warrant extra scrutiny – such as:
- Discover when an unusual flood of traffic hits the site
- Get early warning signs of a DDOS attack
- Alert when traffic to an important page dips below a set amount
- Compare metrics to last week and alert if things are different
- Performance has slowed
With a set of alerts configured and data in your dashboards, you’re up to speed on Real User Monitoring!
Even better, this tool can be extended with added functionality such as Conversion Tracking, Malicious User Detection and Data Breach Monitoring. Give Real User Monitoring a try by requesting a free trial today.