One aspect of my job that I love is meeting teams who are at the coal face. I am always interested to hear how web teams apply technology and methods in their daily life.
With that in mind, I recently visited a website optimisation team at a major retailer. This particular client’s site serves on average 64m pages per month so they have a pretty busy site and as such are under pressure to make continuous performance improvements. I say “team” loosely as the performance optimisation team consists of two people (not an uncommon number).
The team’s role is to keep the company’s eCommerce platform super fast and error free and they are using RapidSpike (along with a couple of other tools) to achieve this. During the meeting I learned how they were using RapidSpike to measure and monitor performance. I thought the story was simple and interesting and would make for interesting reading. This blog therefore maps out the the practical steps they adopt to measure and identify areas of poor site performance using RapidSpike.
Using RapidSpike for eCommerce Monitoring
The story starts with gathering real user performance data, using RapidSpike’s Real User Monitor.
Using the user data gathered, the web team produces a simple management dashboard which is presented at the monthly management meeting. The dashboard records overall site performance metrics and also isolated metrics for mission critical pages. This may sound like hard work and hours of data gathering – but in reality RapidSpike does this automatically. Obviously you might not want to share that with the powers that be 🙂

Using performance data gathered from the customer’s browser, the web team are able to determine whether the site is faster this month versus last month. They also gather the same statistics for key pages and ask the same question – is site performance improving or not?
This allows the team to measure general site performance and to identify pages that warrant further attention. It also allows them to demonstrate where they have made improvements during the month.
Going Deeper into Performance
When a poor performing page has been identified the team then set up a RapidSpike Intelligent Page Monitor (IPM) to inspect the page “DNA”. The IPM records the performance of the page. It measures the download speed not just of the entire page but also every page element. It also records each file type, its size and it also geo-tags each element to identify where it is hosted.
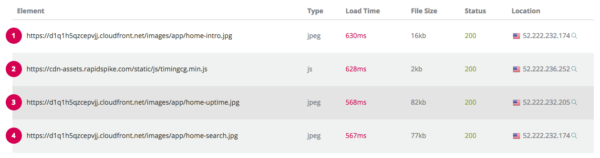
The IPM allows the team to order the results to highlight the worst performing files. The results can also be filtered and ordered based on user preferences. For example, if they want to find the slowest Javascript or CSS file on the page, then they can. In fact, the IPM automatically creates a list of “worst offenders” to save the web team the job.
Tracking Slow or Missing Files
Naturally if any of these files are outside an acceptable tolerance then remedial action can be taken. Often it is a third party link, a Javascript tag or piece of third party software but identifying the culprit is the first step to a better performing page.
Sometimes these changes are small and iterative but that is what it is all about. Al Pacino famously said in Any Given Sunday, “Life is a game of inches.” It’s the small iterative inches that make the difference long term. If you believe in this philosophy then you will love this approach.
Monitoring Processes within your Site or App
The web team also use RapidSpike’s synthetic User Journey Monitoring service to measure key processes like the customer login and checkout. The same reporting process is carried out but they have also configured automatic alerting rules to identify slow steps and actions within the journey automatically.
In other words if the “add to basket” step of a process is outside an acceptable tolerance, then they are the first to know.
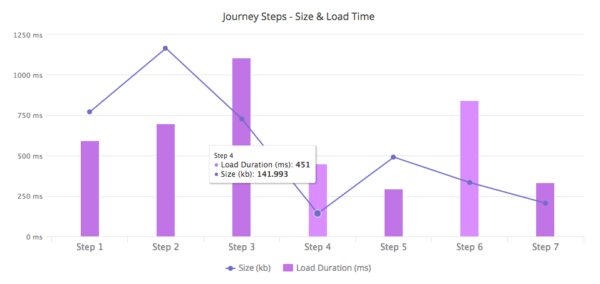
They can then create Notification Rules to contact them (via a variety of ways) if certain conditions are met – for example, identifying poor performing elements that underpin a step or action within a journey.
This allows the optimisation team to continuously measure the performance of critical user processes and to flag components that fall outside an acceptable threshold.
I hope this has been useful. I love genuine and simple stories and I hope this helps you in your role.