We are happy to announce that our developers have been busy again and we have just released a new feature into our plans called Intelligent Page Monitors (IPMs).
This new type of monitor delves a lot deeper into the performance and availability of all elements of your web pages. Its like an MRI scan for your web page.
So, how do IPMs differ from HTTP Uptime Monitors? HTTP Uptime Monitors connect to the web server and check that the page configured in the monitor can be accessed. This works by requesting the page and waiting for the HTTP Response Code of 200 back from the server. This then indicates that the page is being served by the server. This is a pretty rudimental check and only confirms that the web server is serving the page indicated.
This type of monitor is good enough for uptime availability monitoring but totally differs from an IPM.
Intelligent Page Monitors provide in depth analysis of your site by using a real browser in order to totally download and render all aspects of your monitored web page. Each page element is downloaded and inspected. An HTTP Archive (HAR) file is created and the results of this are both interrogated for any errors and then displayed in the UI for your benefit. You can also download this HAR file for offline interrogation or to integrate the values into any other tool that you use.

As well as showing any on-page errors, the performance of the total page and each individual element that makes up the page are recorded. With IPMs, you can run the monitor from various global locations and visually compare the results and page load time from each location to check that your site is performing as it should from the locations of your customers.
The in-depth user interface provides an overview of the page monitor that can be viewed over the past 24 hours, 7 days, 30 days or 2 years depending on your account type. You can also see the detailed results of the last result, or all historical results.

Any events that have occurred are also shown in this interface and detailed information about an event, when they occur is provided to help you remediate the issue identified on the page.
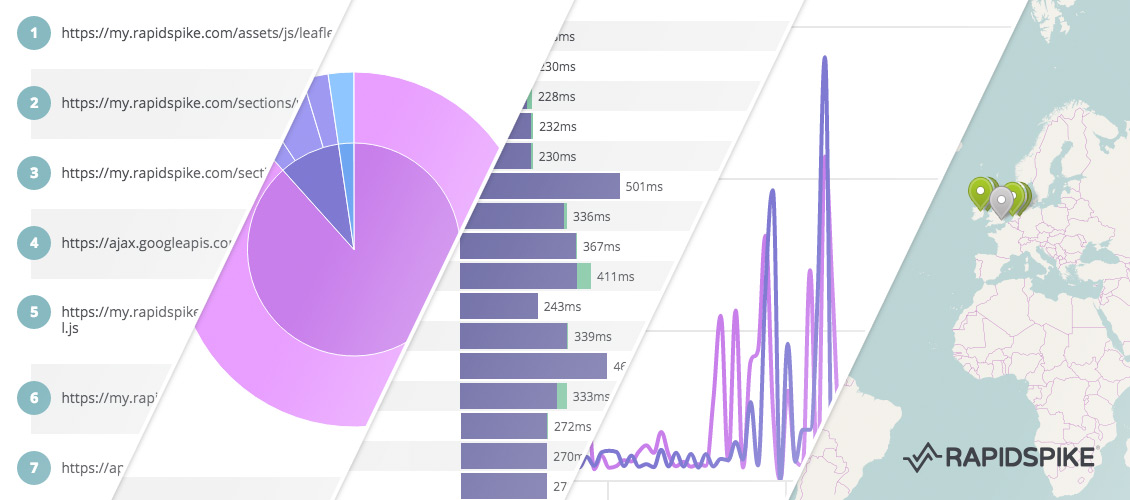
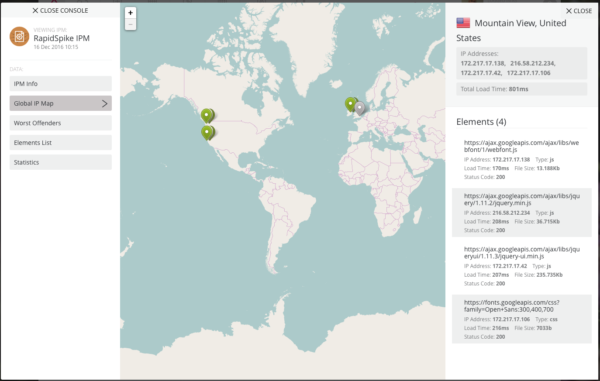
The Console provides a very detailed level of information about the page including a list of all the elements in a waterfall diagram showing concurrent load times. There is also a Global IP map showing you visually where all of the elements of your page are located.
The setting page allows you to chose the locations from which your IPM can be run. The variety of locations is dependant upon your account type, although all customers will have access to at least two. You also have the ability to set a time threshold. When setting this threshold, the total page load time is measured against this threshold and a notification will be received if this threshold is breached.
To add an IPM the website must first exist in your account. You can then go to the Add Wizard and select Intelligent Page Monitor from the options.

The wizard then asks you to select the Website from the dropdown and to enter the page that you wish to be monitored. When completing this wizard, the IPM is then added to your account and can be viewed either when browsing your website or through the specific IPM tab of the Browse menu.
Currently IPMs are available in the Pro account and above as shown on our Pricing Page.